In my military days I was a frequent visitor to the base operations mapping room at just about every base I was stationed. I never flew without a stack of terrain charts in my bag and almost never visited a new airport without first comparing these charts to instrument approach plates. It is a habit I wish I had passed on to more than a few fallen comrades, it could have made a difference. So, in an effort to make up for past sins, here are some techniques on how to become as paranoid as I am when it comes to the cumulus granite.
— James Albright

Updated:
2014-05-24
Of course there is an easier way: Departure Obstacle Avoidance Strategy.
Today we don't need a base operations with taxpayer-funded terrain charts, we have an abundance of electrons at our beck and call. I'll cover some of my favorite sources. Just about all of this is technique.
1 — A primer on topographic maps
2 — Instrument approach charts as source data
3 — U.S. geological survey as source data

1
A primer on topographic maps
The word "topographic" comes from the Greek words topo and graphos. Topo means "place" and graphos means "drawn."
A topographic map is a representation of a three-dimensional surface on a flat piece of paper.
- Contour Lines. A contour is a line connecting points of equal elevation. Notice that on steep slopes the contours are close together and on gentle slopes they are farther apart. The interval of the contour lines usually depends upon the scale of the chart and the terrain depicted.
- Spot Elevations. Spot elevations are the height of a particular point of terrain above an established datum, usually sea level.
- Gradient Tints. The relief indicated by contours is further emphasized on charts by a system of gradient tints. They are used to designate areas within certain elevation ranges by different color tints.
- Shading. Perhaps the most obvious portrayal of relief is supplied by gradual shading applied to the "southeastern" side of elevated terrain and the "northwestern" side of depressions. This shading simulates the shadows cast by elevated features lending a sharply defined, three-dimensional effect.
Source: AFM 51-40, Air Navigation, page 3-26
2
Instrument approach charts as source data
Available plates to the landing runway
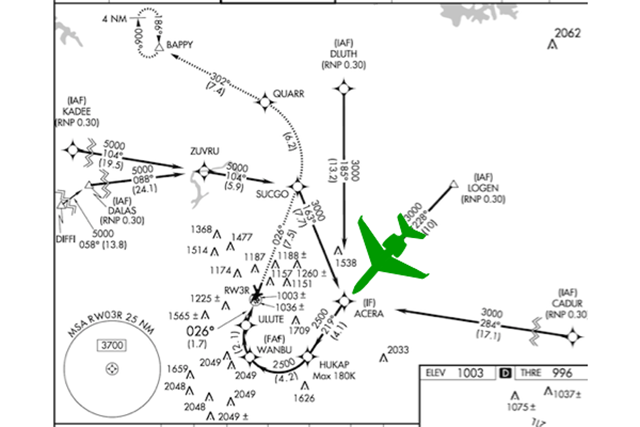
KPDK RNAV(RNP) 3R approach plan view
You should check every available approach plate to your landing runway, some may display greater detail than others. If you have the capability to superimpose the aircraft's position, you will increase your situational awareness even further.
In the example approach to Runway 32 at KPDK (Dekalb-Peachtree, Georgia) the only available approach requires RNAV(RNP) authorization. Even if you don't have that, the approach gives you your best view of several towers that will be at your traffic pattern altitude as you turn right base.
Available plates, opposite runway

Jeppesen KVNY 10-3A, 20 Jul 12
Sometimes taking off in one direction your best obstacle data is presented for arrivals to the opposite runway. Say, for example, you have been assigned the Glendale One Departure from Runway 34L at KVNY (Van Nuys, California). The SID allows lower than standard weather (if authorized) provided you can climb at least 480' per NM to 4200':

Jeppesen, page KVNY 10-3OB1, 23 May 14.
The SID reveals there are takeoff obstacle notes on page 10-3OB1, but those are all for close-in obstacles. The highest obstacle of the northbound bunch is 91' AGL, hardly the reason for the minimum climb gradient.

Jeppesen, page KVNY 11-1, 25 APR 14.
Looking at the approach to the opposite runway, 16R, reveals the relevant obstacles in graphic form. This gives you your best situational awareness with the tools you have available to you in the cockpit.
3
U.S. geological survey as source data
A very good source of free terrain charts of U.S. locations is available at: USGS, United States Geological Survey
Site navigation can be problematic. For a quick start example, look at the departure path at Eagle County (Vail, Colorado) (KGEE):
1. Click on "Maps, Imagery, and Publications
2. Under "Maps" click on "Download free topo maps
3. Under "Search" enter "Vail, CO" (The search engine does not understand three or four letter airport codes).

4. The program displays what it considers the center of Vail. Note that some of the grids might be pink. Those parts of the map exist, but the server has decided to skip them for bandwidth reasons (I think). The maps do exist, they just aren't shown for the moment.
Since we want the departure path west of the airport we need to drag the map until the airport is in view. Click "Navigate" and drag the map westward, following the interstate until the airport is in view.

5. Click "Clear Markers" to avoid having the map skewed to one side we aren't interested in. We can drag the map to center the airport and click on "Mark Points" and click once on the airport to place a marker. The grid lines, shown in yellow/black, show the edges of each available map. You might need to download multiple maps to get the terrain you need. For this example, we are interested in just the airport and the terrain just to the west, so we place our marker in the grid shown.

6. Single click the marker and examine the available products. You should get a selection of various grid sizes and dates. For our example we've selected the 7.5X7.5 GRID 2013. That gives a chart from 39°45'N 107°00'W to 39°37'30"N 106°52'30". Clicking on the file size under the "Download" icon automatically starts the download.
7. We end up with a very nice, detailed terrain chart:

I adjusted this picture downward for ease of viewing. The downloaded product is 22.75 x 29 inches in size and over 31 MB. The scale of the map is 1:24,000.
4
Google Earth as source data

Jeppesen, page TVSV 16-1, 2 Aug 13
If you really want to improve your situational awareness for just about any airport in the world, nothing beats Google Earth. It is available for download free at www.google.com/earth/. You already know Google Earth you say? Well did you know it will give you a profile view of the terrain below your flight path?
Let's fly to Kingstown Airport in St. Vincent for an example.
There are only two plates in the Jeppesen Airways Manual: the airport diagram and one instrument approach. From the airport diagram we see something worrisome:
- Caution: Circling to land not authorized north and east of rwy 07-25.
- Rapidly rising terrain surrounds runway.
- Take-off on rwy 07 not normally permitted due to high terrain.
- Runway 07 normally used for landing, rwy 25 normally used for take-off.
I once flew here on a GV charter for a less than reputable charter company. Looking at this, I thought they might insist I land on Runway 25 and takeoff on Runway 07 if the winds dictated. I wanted to get my ducks in line.

Jeppesen, page TVSV 16-1, 2 Aug 13.
The only other available chart provided little comfort but few details. My only recourse was to find a source of terrain charts, which turned out to be in England, and pay nearly $50 in rush delivery and other fees to find what I needed. These days we have a better alternative: Google Earth.
I recommend you make this a priority, if you don't already have Google Earth installed on the computer you use for flight planning, go get it now. (www.google.com/earth/.) Do it now, I'll wait . . .
After you start the program enter the airport's identifier in the "Search" dialogue box and press "Search." (For our example, use TVSV.)
These screen shots are from a Mac, the PC version should be similar.

Google Earth TVSV Example
You should end up with a close-up view of the airport, directly overhead. The bottom right of the screen tells you that you are looking down from a height of 3,315' and the imagery is as of 2/7/2010.
At the top right of the screen are some navigation tools. Ignore the top two for now, we will be using the third control, the one with the "+" and "-" symbols with a slider in the middle. Press the "-" a few times to zoom out so you can see the opposite shore:

Google Earth TVSV Example
You can use drag the entire image and manipulate the "+" and "-" zoom controls until you can see the airport and the shoreline to the north-east.
Now click on the "Add path" icon, the one that looks like three waypoints connected by lines:

Google Earth TVSV Example
You can enter a name for the path you are about to draw, I chose to type: "TVSV Runway 07 Departure" but do not press enter or click "OK" just yet.

Google Earth TVSV Example
Single click a spot at the departure end of Runway 07 and move the cursor straight out to the opposite shoreline for a second click. The program will draw a line for you.
Now you can click "Ok"

Google Earth TVSV Example
Now click on the "Edit" menu and select "Show Elevation Profile" as shown:

Google Earth TVSV Example
The program draws you a graph of the terrain elevation along the line you drew:

Google Earth TVSV Example
From this we see the terrain rises rapidly up to 1,051' about 2.1 sm from the end of the runway. The elevation of the departure end is 46' but under 14 CFR 135 we need to clear all obstacles by 35' so we need to be at least 1,051 - 46 + 35 = 1040' over that hill. Your climb gradient will be:
Will a GV beat this climb gradient? Yes. But, as we know, there is more to consider than math and just looking at the terrain rise in graphic form should be enough to dissuade any sane pilot from attempting a takeoff on Runway 07 from TVSV.
5
Example problem

Jeppesen, page KBAF 10-3, 26 Apr 13.
Here is a recent example showing each of these tools in action to validate a plan of attack. We often use Westfield / Springfield, MA (KBAF) for Gulfstream maintenance, but they usually favor their longer runways, 02 and 20. My last time there that runway was closed and the winds dictated using runway 33 for landing and takeoff. There is terrain in that direction, I knew, but would it be a factor?

Jeppesen, page KBAF 10-3-1, 26 Apr 13
This pages tells me I will need to climb at least 323' per NM up to 2,000' to takeoff with less than standard weather minimums, but it doesn't give a clue why. All of the obstacles in the text are close-in. A few of the instrument approach charts shed a little light on the Runway 33 departure, but not a lot.

USGS
The USGS topographic chart shows much more detail and gives us a few clues, but the airport lies at the border of the chart. We note that the added portion we want is just to the west around 46°72' N:
After we fire up the USGS website a second time we have this:

USGS
Downloading that map, we see most of the terrain is well to the west. With a little cutting and pasting, we can be reassured our takeoff obstacles are easily dealt with.
While this certainly works, it would have been a lot easier to pull up Google Earth:

USGS
Now we see the terrain doesn't really rise much at all for over three miles. Based on this, we can use runway 33 and feel confident we can deal with the climb gradient.
Note that the elevation profile, from left to right, reflects from the start point (the runway) to the end point. The course on the map, of course, goes from right to left. There are a few quirks like this with the program, not a big issue but something to be aware of.
References
(Source material)
Air Force Manual (AFM) 51-40, Air Navigation, Flying Training, 1 July 1973
Jeppesen Airway Manuals
USGS, United States Geological Survey