Every year or so we have another case of a passenger-carrying-airplane sliding off the end of a runway and a fair amount of recriminations from all the usual suspects. More often than not, pilot error is implicated and more of the usual suspects issue a call for pilots to stop floating down the runway and to be more serious about the things that make the airplane stop.
— James Albright

Updated:
2020-02-16
Southwest 1248
NTSB Report, Figure 1.
Take, for example, the December 8, 2005 crash of Southwest Airlines Flight 1248. I flew in as a passenger on a SWA flight the week prior and witnessed the pilot grease the landing a little long and use no more than idle reverse. A month after the crash I had another flight on the same airline and same runway: firm landing, full reverse. Much better. Six months later? Back to their old habits.
The next year, the FAA issued SAFO 06012, since replaced by SAFO 19001, advocating a 15% margin between the expected actual airplane landing distance and landing distance available at the time of arrival. Ten years after that, the FAA issued SAFO 16009, implementing a new way of evaluating runway condition.
But, despite these efforts, we still have aircraft failing to stop on the confines of a wet or contaminated runway. But even if you are wise and experienced in these things, there have been changes you need to know about. So let's look at the problem anew.
1 — Runway contamination defined by governments
2 — Runway contamination applied by manufacturers
4 — Braking action reports and advisories
6 — Other braking condition reporting
8 — Pre-departure decision making
11 — Pilot procedures: the flare
12 — Pilot procedures: after touchdown and reverse thrust
13 — Pilot procedures: avoiding hydroplaning
14 — Pilot procedures: braking

1
Runway contamination defined by governments
When is a runway contaminated? When is a runway wet? Here's a new one: when is a runway damp? These may seem like silly distinctions, but they all matter when it comes to converting the runway condition report into aircraft performance numbers.
United States — All Operators
Here's what they tell us pilots:
CONTAMINATED RUNWAY − A runway is considered contaminated whenever standing water, ice, snow, slush, frost in any form, heavy rubber, or other substances are present. A runway is contaminated with respect to rubber deposits or other friction-degrading substances when the average friction value for any 500-foot segment of the runway within the ALD fails below the recommended minimum friction level and the average friction value in the adjacent 500-foot segments falls below the maintenance planning friction level.
Source: Aeronautical Information Manual, Pilot/Controller Glossary
So that's "contaminated." What about "wet?"
The standard dry runway charts are for a totally dry runway. NOTE: For example, if the ramp is too damp to sit on due to morning dew, the runway is probably the same. The pilot should use the wet or contaminated performance data.
Source: AC 91-79A, App. 3, ¶5.
That is a bit silly for my tastes. Here's what they tell airport operators:
Runway Condition Code (RwyCC). Runway Condition Codes describe runway conditions based on defined contaminants for each runway third. Use of RwyCCs harmonizes with ICAO Annex 14, providing a standardized “shorthand” format (e.g., 4/3/2) for reporting. RwyCCs are used by pilots to conduct landing performance assessments.
Source: AC 150/5200-30D, ¶1.12.17
FICON (Field Condition Report). A FICON is a Notice to Airmen (NOTAM) generated to reflect pavement surface conditions on runways, taxiways, and aprons and Runway Condition Codes (RwyCCs) if greater than 25 percent of the overall runway length and width coverage or cleared width of the runway is contaminated.
Source: AC 150/5200-30D, ¶1.12.8
Contaminated Runway. For purposes of generating a runway condition code and airplane performance, a runway is considered contaminated when more than 25 percent of the overall runway length and width coverage or cleared width is covered by frost, ice, or any depth of snow, slush, or water.
Source: AC 150/5200-30D, ¶1.12.4
Dry Runway/Pavement. Use the term “DRY” to describe runway/pavement surfaces that are neither wet nor contaminated. A FICON NOTAM must not be originated for the sole purpose of reporting a dry runway. A dry runway surface should be reported only when there is need to report conditions on the remainder of the surface.
Source: AC 150/5200-30D, ¶1.12.5
Wet Runway. A runway is wet when it is neither dry nor contaminated. For purposes of condition reporting and airplane performance, a runway can be considered wet when more than 25 percent of the overall runway length and width coverage or cleared width being used is covered by any visible dampness or water that is 1/8-inch (3 mm) or less in depth.
Source: AC 150/5200-30D, ¶1.12.23
Dry Snow. Dry snow is snow that has insufficient free water to cause it to stick together. This generally occurs at temperatures well below 32° F (0° C). If when making a snowball, it falls apart, the snow is considered dry.
Source: AC 150/5200-30D, ¶1.12.6
Wet Snow. Wet snow is snow that has grains coated with liquid water, which bonds the mass together, but that has no excess water in the pore spaces. A well-compacted, solid snowball can be made, but water will not squeeze out.
Source: AC 150/5200-30D, ¶1.12.24
Slush. Slush is snow that has water content exceeding a freely drained condition such that it takes on fluid properties (e.g., flowing and splashing). Water will drain from slush when a handful is picked up. This type of water-saturated snow will be displaced with a splatter by a heel and toe slap-down motion against the ground.
Source: AC 150/5200-30D, ¶1.12.20
Water. Water is the liquid state of water. For purposes of condition reporting and airplane performance, water is greater than 1/8-inch (3mm) in depth.
Source: AC 150/5200-30D, ¶1.12.21
Ice. Ice is the solid form of frozen water including ice that is textured (i.e., rough or scarified ice). Note: A layer of ice over compacted snow must be reported as ice only.
Source: AC 150/5200-30D, ¶1.12.10
Wet Ice. Wet ice is ice that is melting, or ice with a layer of water (any depth) on top.
Source: AC 150/5200-30D, ¶1.12.22
International Civil Aviation Organization - Commercial Operators
- Contaminated runway. A runway is contaminated when more than 25 per cent of the runway surface area (whether in isolated areas or not) within the required length and width being used is covered by:
- water, or slush more than 3 mm (0.125 in) deep;
- loose snow more than 20 mm (0.75 in) deep; or
- compacted snow or ice, including wet ice.
- Dry runway. A dry runway is one which is clear of contaminants and visible moisture within the required length and the width being used.
- Wet runway. A runway that is neither dry nor contaminated.
Note 1.— In certain situations, it may be appropriate to consider the runway contaminated even when it does not meet the above definition. For example, if less than 25 per cent of the runway surface area is covered with water, slush, snow or ice, but it is located where rotation or lift-off will occur, or during the high speed part of the take-off roll, the effect will be far more significant than if it were encountered early in take-off while at low speed. In this situation, the runway should be considered to be contaminated.
Note 2.— Similarly, a runway that is dry in the area where braking would occur during a high speed rejected take-off, but damp or wet (without measurable water depth) in the area where acceleration would occur, may be considered to be dry for computing take-off performance. For example, if the first 25 per cent of the runway was damp, but the remaining runway length was dry, the runway would be wet using the definitions above. However, since a wet runway does not affect acceleration, and the braking portion of a rejected take-off would take place on a dry surface, it would be appropriate to use dry runway take-off performance.
Source: ICAO Annex 6, Part 1, Att B, Page B-2
The ICAO definition in Annex 6, Part I, applies only to commercial aviation. The same definition does not appear in Part II for general aviation.
European Union — Commercial Operators
- "Contaminated runway". A runway is considered to be contaminated when more than 25 % of the runway surface area (whether in isolated areas or not) within the required length and width being used is covered by the following:
- surface water more than 3 mm (0,125 in) deep, or by slush, or loose snow, equivalent to more than 3 mm (0,125 in) of water;
- snow which has been compressed into a solid mass which resists further compression and will hold together or break into lumps if picked up (compacted snow); or
- ice, including wet ice.
- "Damp runway". A runway is considered damp when the surface is not dry, but when the moisture on it does not give it a shiny appearance.
- "Dry runway". A dry runway is one which is neither wet nor contaminated, and includes those paved runways which have been specially prepared with grooves or porous pavement and maintained to retain "effectively dry" braking action even when moisture is present.
Source: EASA Air Ops Annex 1 to VIII, §ANNEX 1
Not every manufacturer allows you to assume a grooved runway is "effectively dry."
- "Wet runway." A runway is considered wet when the runway surface is covered with water, or equivalent, less than specified in subparagraph (a)(2) above or when there is sufficient moisture on the runway surface to cause it to appear reflective, but without significant areas of standing water.
Source: EASA Air Ops Annex 1 to VIII, §ANNEX 1
The use of the term "reflective" is quite helpful, but it seems only EASA uses it any more.
A Conservative Approach to Runway Dry / Damp / Wet / Contaminated
U.S. rules tend to lag (but eventually follow) ICAO rules, which tend to be less restrictive than EASA rules. I think it is helpful to know the most restrictive rules if you fly all over the world. Things get complicated by the aircraft manufacturers, but this is a way to begin getting a handle on all this.
A runway is dry . . .
. . . if if it is free of visible moisture.
A runway is "effectively dry". . .
. . . if it is grooved or a specially prepared porous pavement and maintained to retain dry braking action even when moisture is present.
A runway is damp . . .
. . . if there is a moisture layer that is not shiny.
A runway is wet . . .
. . . if there is enough moisture on the runway surface to cause it to be reflective, but without significant areas of standing water, OR
. . . if it is covered in water (or the equivalent) and no more than 25% of that is no more than 1/8" (3 mm) of water or the equivalent in slush or loose snow.
A runway is contaminated . . .
. . . if more than 25% of it is covered by water more than 1/8" (3 mm) water water or the equivalent in slush or loose snow.
. . . if more than 25% of it is covered in compressed or compacted snow, ice, or wet ice.
You are permitted to consider only that portion of the runway you need. They can, for example, plow only the center and a limited distance. You should be careful that the width will permit full control of the airplane in the event of an engine loss.
2
Runway contamination applied by manufacturers
We pilots are constrained by the rules as defined by governments, of course. But we are also constrained by how our aircraft manufacturers apply these rules. There are even differences between aircraft types from the same manufacturer. You just have to know the books for the airplanes you fly. Be aware, however, that aircraft manufacturer data can be optimistic.
Aircraft manufacturers have an additional challenge in translating the extrapolated performance data required by aircraft certification rules and the various definitions into performance numbers we pilots can use. Bombardier and Gulfstream, for example, invent a few new definitions that you won't find in use by the various regulatory agencies. Loose wet snow and loose dry snow, for example. While it may seem nonsensical, it does help convert reports into other numbers that can be used to predict aircraft performance. You can argue about which manufacturer has better numbers but it doesn't matter. It is up to us as pilots to understand the methodology behind the definitions and the reliability of the numbers that result.
Bombardier Example
- RUNWAY CONTAMINATED BY STANDING WATER, SLUSH OR LOOSE SNOW
A runway is considered to be contaminated, when more than 25% of the runway surface area (whether in isolated areas or not), within the required length and width being used, is covered by more than 3 millimeters (1/8 inch) of standing water or its equivalent in slush or loose snow (see table below): - RUNWAY CONTAMINATED BY COMPACTED SNOW
A runway is considered to be contaminated by compacted snow when covered by snow which has been compacted into a solid mass which resists further compression and will hold together or break into lumps if picked up. - RUNWAY CONTAMINATED BY ICE
A runway surface condition where braking action is expected to be very low, due to the presence of ice.
| STANDING WATER | SLUSH | LOOSE WET SNOW | LOOSE DRY SNOW |
| 3.2 mm (0.125 in) | 3.8 mm (0.15 in) | 7.6 mm (0.30 in) | 15.2 mm (0.60 in) |
| 6.4 mm (0.25 in) | 7.6 mm (0.30 in) | 15.2 mm (0.60 in) | 30.5 mm (1.2 in) |
Source: Bombardier BD-700 Airplane Flight Manual, §07-03-01-1, ¶1.B.
Gulfstream
- Dry runway: A runway is considered dry if it is clear of visible moisture. A damp runway, which has a moisture layer that is nonreflective, is also considered dry.
- Wet runway: A runway is considered to be wet when there is sufficient moisture to cause it to appear reflective but the depth of the water is not more than 3 mm (0.125 in.).
- Contaminated runway: A runway surface is considered contaminated when more than 25% of the runway surface area is covered with standing water, slush, loose snow (dry or wet), compacted snow or ice.
- Standing water: Water depth is greater than 3 mm (.125 in).
- Slush: Partly melted snow or ice with a high water content, from which water can readily flow.
- Compacted snow: Snow which has been compressed into a solid mass such that the airplane wheels will run on the surface without causing significant rutting.
- Loose snow: Snow on the runway surface which had not been compressed by vehicle or aircraft traffic. Loose snow can consist of either dry snow or wet snow.
- Dry loose snow: Fresh snow that can be blown, or, if compressed by hand, will fall apart upon release.
- Wet loose snow: Snow that will stick together when compressed, but will not readily allow water to flow from it when squeezed
- Ice: Water which has frozen on the runway surface, including the condition where compacted snow transitions to a polished ice surface.
Source: Gulfstream G450 Operational Information Supplement, G450-OIS-02, Section A.
A Caveat for All Aircraft
There is a case to be made that the wet runway distances predicted by your Airplane Flight Manual is optimistic:
- The μB [wheel braking coefficient] deficit observed in the events considered in this paper makes the stopping performance of the airplanes involved more consistent with AFM landing distances for runways contaminated with standing water, than for runways that are merely “wet.” For this reason, observers may be (understandably) quick to conclude that the runways involved must be more contaminated (contain a greater depth of water) than assumed in the wet runway models underlying the AFM distances. However, examination of the runways involved, including an examination of their macrotexture and cross-slope, do not support a conclusion that the runways could have been flooded given the rainfall rates during the events in question. Furthermore, the μB actually achieved in a number of these events is consistent with the NASA CFME model for a wet – not flooded – runway. In other words, the NASA CFME model for a wet runway is more conservative than those underlying the airplane AFMs, and moreover, matches the actual airplane performance achieved during the events better than those underlying the AFMs.
Source: Callaghan, §VIII, ¶A.
Your contaminated data appears to be okay; your merely "wet" data appears to be optimistic.
- The FAA has recognized the reality of this μB deficit, and the need to address it, in several documents and actions. SAFO 15009 warns operators that “the advisory data for wet runway landings may not provide a safe stopping margin under all conditions,” and advises them to assume “a braking action of medium or fair when computing time-of-arrival landing performance or [increase] the factor applied to the wet runway time-of-arrival landing performance data.” Moreover, the Transport Airplane Performance and Handling Characteristics ARAC was given a new task to address “wet runway stopping performance.”
Source: Callaghan, §VIII, ¶A.
The Runway Condition Assessment Matrix (RCAM) is the intended fix.
See also: SAFO 16009.
- In addition, AC 25-32, Landing Performance Data for Time-of-Arrival Landing Performance Assessments, incorporates many of the recommendations of the TALPA ARC, including the RCAM. However, wet (not flooded) runways can either be classified as RCAM code 5 (associated with μB levels defined by the §25.109(c) model), or as RCAM code 3 “slippery when wet” (for which μB = 0.16 constant). The “slippery when wet” designation applies when the average CFME μ of the runway falls below the AC 150/5320-12C MIN LEVEL – a condition that only one of the runways examined in this paper met. The actual μB levels achieved on the other runways was between those specified by RCAM codes 5 and 3. Consequently, the RCAM as currently specified in Ref. 32 will likely overestimate the μB that can actually be achieved on operational, wet runways.
Source: Callaghan, §VIII, ¶A.
3
Equivalent water depth
Most regulatory agencies and manufacturers dance around the phrase "or equivalent," leaving that to us. You may not be flying a Gulfstream, but using their chart might give you more information than what you already have. (Better than nothing.)
- Airport operations on wet loose snow and slush-covered runways are treated in a similar manner as operations on a runway contaminated with standing water. The only difference is that because of different densities, a measurable depth of wet loose snow (50% the density of water) or slush (85% the density of water) must first be converted to an equivalent depth of standing water. This is accomplished by using the conversion data presented in Table 1a below. The data in this table can be interpolated for intermediate depths of contamination, e.g., 15 mm (0.6 in) of wet loose snow is equivalent to 7.5 mm (0.3 in) of standing water. Otherwise, hydroplaning speeds, tire displacement drag and spray impingement drag on runways with wet loose snow and slush are determined in a manner that is similar to a runway contaminated with standing water. This equivalent water depth is the value to be used as the Runway Surface Contamination (RSC) depth when computing takeoff performance.
- EASA has developed separate standards for classifying dry loose snow and wet loose snow. Under the new EASA contaminated runway rules for runways contaminated with dry loose snow, it is no longer necessary to account for spray impingement drag and hydroplaning speeds. Therefore, it is possible to takeoff and land in a much greater depth of dry loose snow than wet loose snow. In addition, dry loose snow is assumed to have a density that is only 20% the density of water. In consideration of these differences, Gulfstream has determined that it is conservative to divide the effective dry loose snow depth by 6 in order to establish the equivalent water depth to use when determining takeoff performance on a runway contaminated by dry loose snow. Hence, 21 mm (0.84 in.) of dry loose snow converts to 3.5 mm (0.14 in) of standing water.
Source: Gulfstream G450 Operational Information Supplement, G450-OIS-02, Section A.
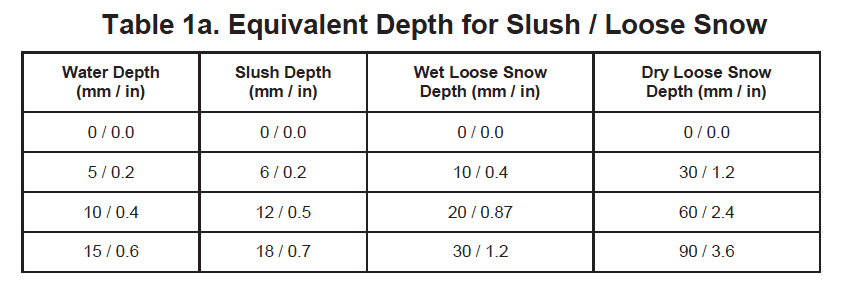
Equivalent depth for slush/loose snow, from Gulfstream G450 Operational Information Supplement, G450-OIS-02, Table 1a.
4
Braking action reports and advisories
Whenever you land on a wet or contaminated runway, you may be adding to the airport's knowledge about that runway's braking effectiveness. By the same token the aircraft that landed just before you should add to your personal knowledge about what is ahead of you. But you need to weigh carefully the type of aircraft making the report. A small, light aircraft may have much more difficulty on a slippery surface than a heavier jet. I've never seen this fact quantified, but it is something to be wary of.
- When available, ATC furnishes pilots the quality of braking action received from pilots. The quality of braking action is described by the terms “good,” “good to medium,” “medium,” “medium to poor,” “poor,” and “nil.” When pilots report the quality of braking action by using the terms noted above, they should use descriptive terms that are easily understood, such as, “braking action poor the first/last half of the runway,” together with the particular type of aircraft.
- When tower controllers receive runway braking action reports which include the terms medium, poor, or nil, or whenever weather conditions are conducive to deteriorating or rapidly changing runway braking conditions, the tower will include on the ATIS broadcast the statement, “BRAKING ACTION ADVISORIES ARE IN EFFECT.”
- During the time that braking action advisories are in effect, ATC will issue the most recent braking action report for the runway in use to each arriving and departing aircraft. Pilots should be prepared for deteriorating braking conditions and should request current runway condition information if not issued by controllers. Pilots should also be prepared to provide a descriptive runway condition report to controllers after landing.
Source: Aeronautical Information Manual §4−3−8
A Pilot Report (PIREP) reflecting the brake contribution to the airplane’s deceleration. A PIREP Braking Action Report reflects the pilots’ impression of the available wheel braking. The report may also be based on directional control feedback. The parameters are as follows;
- Good – Braking deceleration is normal for the wheel braking effort applied, and directional control is normal.
- Good to Medium – Braking deceleration OR directional control is between Good and Medium; i.e. Braking deceleration is between “normal and noticeably reduced for the wheel braking effort applied” AND “directional control is between normal and noticeably reduced”.
- Medium – Braking deceleration is noticeably reduced for the wheel braking effort applied OR directional control is noticeably reduced.
- Medium to Poor – Braking deceleration OR directional control is between Medium and Poor; i.e., Braking deceleration is between “noticeably reduced and significantly reduced for the wheel braking effort applied” AND “directional control is between noticeably reduced and significantly reduced”.
- Poor – Braking deceleration is significantly reduced for the wheel braking effort applied OR directional control is significantly reduced.
- Nil – Braking deceleration is minimal to non-existent for the wheel braking effort applied OR directional control is uncertain.
Source: SAFO 19003, Pilot Braking Action Report
Items to be considered to determine if the braking action report is reliable:
- Similar weight and class of airplane. An example would be the Boeing 737 and Airbus 320, where the weight and gear track are similar.
- Time since braking action report was given. For example, stable conditions with cold temperature and no active precipitation will likely be reliable for a longer time than reports provided during an active precipitation event with temperatures near 0-degrees Celsius.
Source: SAFO 19003, Reliable Braking Action Report
Generally speaking, a lighter aircraft will have a more difficult time stopping than a heavier airplane. I once landed behind a light twin aircraft that had called the braking action "poor" on hard, compacted snow at Gander Airport. I thought the braking action was "good" in my Gulfstream III.
5
Runway condition reports
As hard as we've tried over the years, we can't seem to come up with a definitive way of translating the condition of a runway into a number that we can plug into tables and charts to figure out our likelihood of stopping the airplane in the amount of runway in front of us. Our most recent attempt is known as a "Runway Condition Code" taken from a "Runway Condition Assessment Matrix." So that's what is shown here. (If this is news to you, it was first unveiled with SAFO 16009.) I'll follow that with some of the older systems in case you run into them.
Landing overruns that occur on wet runways typically involve multiple contributing factors such as long touchdown, improper use of deceleration devices, tailwind and less available friction than expected. Several recent runway-landing incidents/accidents have raised concerns with wet runway stopping performance assumptions. Analysis of the stopping data from these incidents/accidents indicates the braking coefficient of friction in each case was significantly lower than expected for a wet runway as defined by Title 14 of the Code of Federal Regulations (14 CFR) part 25 § Section 25.109 and Advisory Circular (AC) 25-7D methods. These incidents/accidents occurred on both grooved and un-grooved runways. The data indicates that applying a 15% safety margin to wet runway time-of-arrival advisory data, as recommended by SAFO 06012 (or current guidance), may be inadequate in certain wet runway conditions. Takeoff and Landing Performance Assessment (TALPA) procedures implemented by the FAA on October 1, 2016, added new insight as to how flightcrews can evaluate runway braking performance prior to landing. TALPA defines WET as “Includes damp and 1/8-inch depth or less of water,” while CONTAMINATED is “greater than 1/8-inch of water.”
Source: SAFO 19003, Background
As a result of this SAFO, the Runway Condition Code (RCC) was invented . . .
How the Airport Operator Gets the Word Out
Changes to ENI, from NOTAM Manager Training Presentation, slide 19
To comply with § 139.339, the airport operator must utilize the NOTAM system as the 5.1.3primary method for collection and dissemination of airport information to air carriers and other airport users. When disseminating airport condition information there are three methods available to airport operators. The first and preferred method is NOTAM Manager, a direct-entry system.
Source: AC 150/5200-30D, ¶5.1.3
The NOTAM Manager is a web-based application available to airport operators that directly inputs NOTAMs into the U.S. NOTAM system. It is important to note that the system is accessed through pull down menus that limit the airport operator's options on what can be inputted. This essentially "ties their hands" and can lead to some confusion if pilots don't understand the constraints of the NOTAM system. (More on that below.)
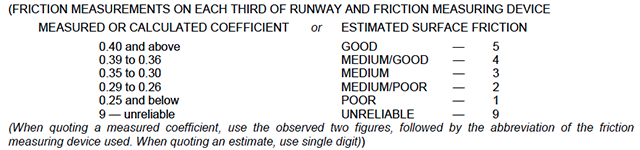
RCCs for Pilots (At least according to AIM)
If you hear your runway is reporting a "3/3/3" is that good? Well it means all three segments of the runway are "medium" so I guess that's better than a "2/2/2" but not as good as a "5/5/5" as you might suspect. But this is the system we have now and it is actually better than those "mu" or "RCR" numbers of the past in that they are supposed to be more accurate. I'm not so sure, but here is what the book says followed by some added information from the airport management side of the house.
- Aircraft braking coefficient is dependent upon the surface friction between the tires on the aircraft wheels and the pavement surface. Less friction means less aircraft braking coefficient and less aircraft braking response.
- Runway condition code (RwyCC) values range from 1 (poor) to 6 (dry). For frozen contaminants on runway surfaces, a runway condition code reading of 4 indicates the level when braking deceleration or directional control is between good and medium.
- Airport management should conduct runway condition assessments on wet runways or runways covered with compacted snow and/or ice.
- Numerical readings may be obtained by using the Runway Condition Assessment Matrix (RCAM). The RCAM provides the airport operator with data to complete the report that includes the following:
- Runway(s) in use
- Time of the assessment
- Runway condition codes for each zone (touchdown, mid−point, roll−out)
- Pilot−reported braking action report (if available)
- The contaminant (for example, wet snow, dry snow, slush, ice, etc.)
- Assessments for each zone (see 4−3−9c1(c)) will be issued in the direction of takeoff and landing on the runway, ranging from “1” to “6” to describe contaminated surfaces.
- When any 1 or more runway condition codes are reported as less than 6, airport management must notify ATC for dissemination to pilots.
- Controllers will not issue runway condition codes when all 3 segments of a runway are reporting values of 6.
- When runway condition code reports are provided by airport management, the ATC facility providing approach control or local airport advisory must provide the report to all pilots.
- Pilots should use runway condition code information with other knowledge including aircraft performance characteristics, type, and weight, previous experience, wind conditions, and aircraft tire type (such as bias ply vs. radial constructed) to determine runway suitability.
- The Runway Condition Assessment Matrix identifies the descriptive terms “good,” “good to medium,” “medium,” “medium to poor,” “poor,” and “nil” used in braking action reports.
Source: Aeronautical Information Manual §4−3−9
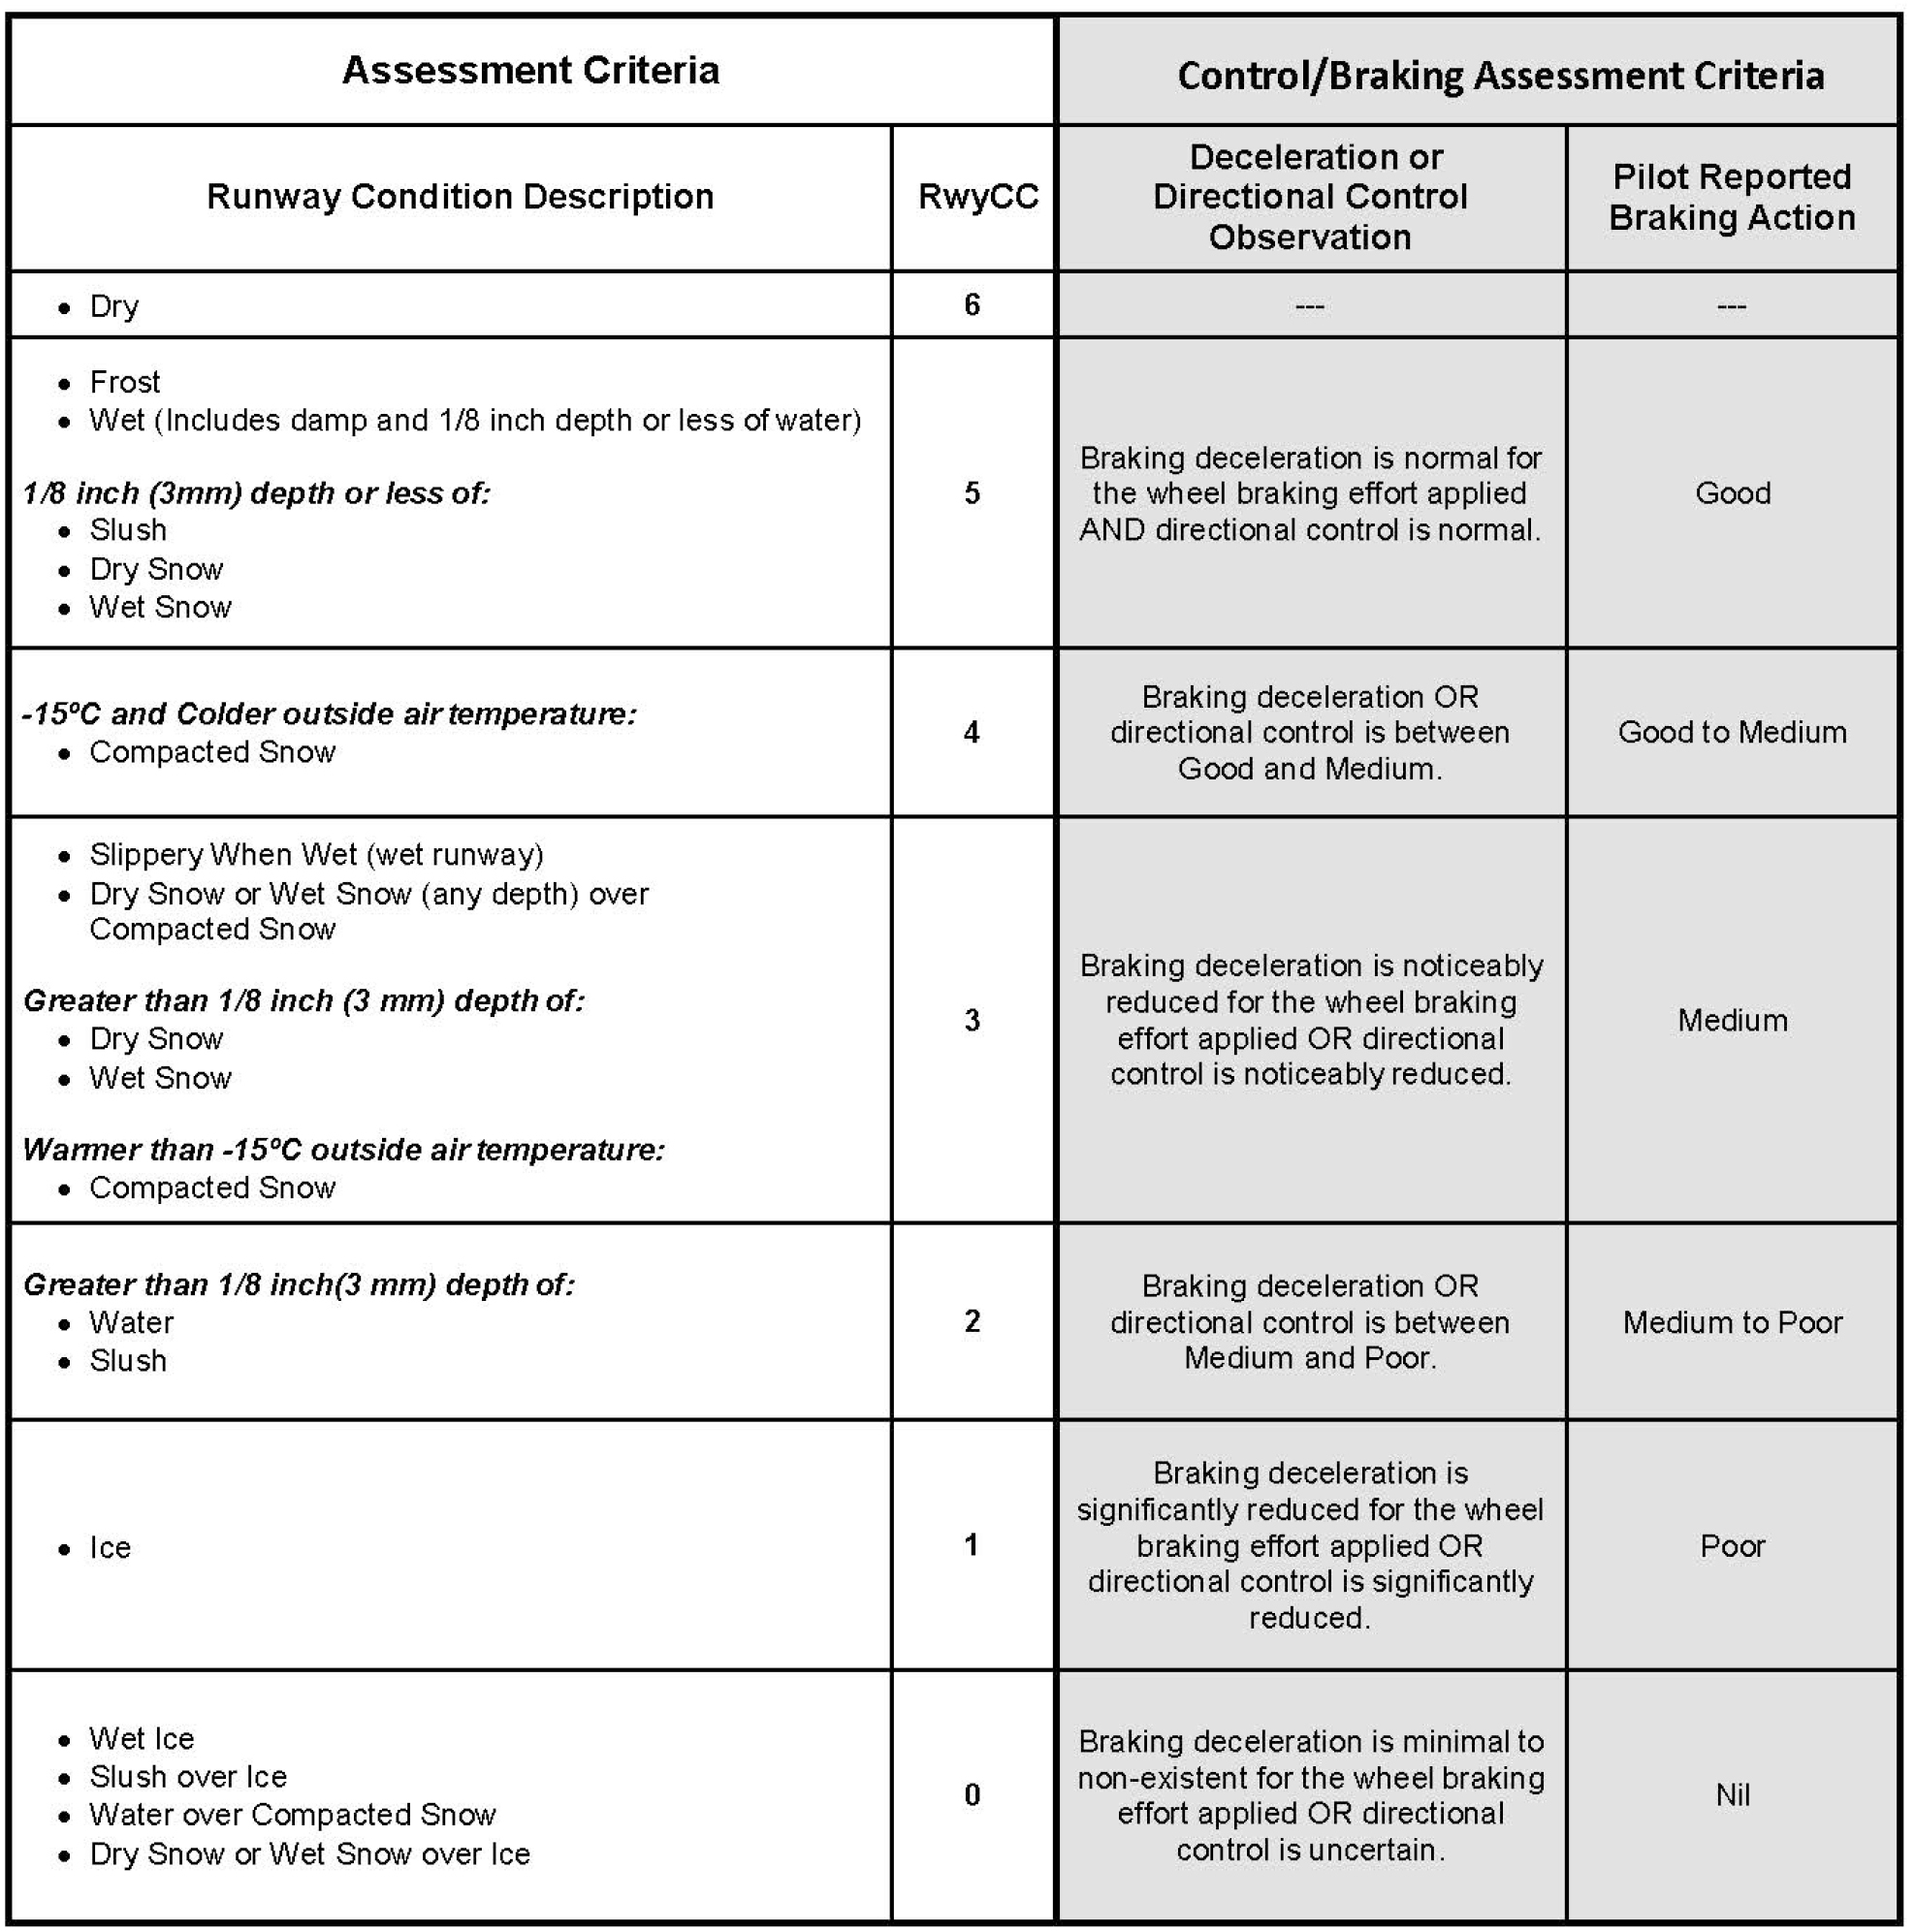
Runway Condition Assessment Matrix, AIM, figure 4-3-7.
Understanding the RCC for Better Decision Making
It seems like we've replaced highly subjective words ("good," "medium," "poor," and "nil") for seven numbers that may seem equally subjective. It also seems we gave up the science of the "Mu" number that is still used with the ICAO SNOWTAM system. But the change actually has more good than bad. We pilots don't understand the process as well as we should and are too quick to hear the three magic numbers and stop listening. If you understand how the numbers are produced and the importance of the language that follows, you might have some very useful decision making tools. AC 150/5200-30D is what airport operators use to manage runway and taxiway reporting and snow removal. It has a lot of good information for pilots who want to "read between the lines" when it comes to an RCC.
Following the overrun accident of a Boeing-737 in December of 2005, the FAA found that the current state of the industry practices did not have adequate guidance and regulation addressing operation on non-dry, non-wet runways, i.e., contaminated runways. As such, the FAA chartered an Aviation Rulemaking Committee (ARC) to address Takeoff and Landing Performance Assessment (TALPA) requirements for the appropriate parts 23, 25, 91 subpart K, 121, 125, 135, and 139. In formulating recommendations, it became clear to the ARC that the ability to communicate actual runway conditions to the pilots in real time and in terms that directly relate to expected aircraft performance was critical to the success of the project.
Source: AC 150/5200-30D, ¶1.2.1
The ARC got it mostly right but we need to keep in mind this was an industry-wide effort and though the business aviation community was represented, the largest users (the airlines) obviously carried more weight. So we got a system that is tailored towards large airports with sophisticated snow removal equipment. The system is also "one size fits all," so terms like "ice" on a runway in Alaska (dry and compacted and therefore rough) is equal to "ice" in New England (covered with a film of supercooled water). So let's tackle this. Is the RCC a subjective measure? To find out, we should look at the RCAM presented above in AIM (a pilot's manual) to what the airport operator is given. But you can't do that unless you understand μ . . .
So What is Mu (μ) Any Way?
Time for some basic engineering:
Ff = μFN
where:
Ff is the friction force in Newtons
μ is the coefficient of friction
FN is the normal force in Newtons
A Newton is the International System of Units (SI) derived unit of force. One Newton is equal to the force needed to accelerate a mass of one kilogram one meter per second per second. For more about this: Mechanics.
There are several kinds of friction but there are two in particular of interest to us pilots: static and dynamic. If the tires of your wheels are making good contact with the surface and not sliding in relation to the surface, you have static friction. If, on the other hand, the wheels are skidding or hydroplaning, there is motion of the tire in relation to the surface and that is dynamics friction. The only way to stop the airplane is to maintain static friction, so that's what we will concentrate on here.
Static friction: the force that resists movement of an object pressed against a surface.
So . . .
Coefficient of static friction (μs) is the minimum force required to get an object to move on a surface divided by the forces holding them together.
How about in English? If the surface is very "grippy" and will not allow the object to slide, it can have a coefficient of friction of 1.0 — meaning it would take just as much force to lift the object as it would to push it. If the surface is extremely slippery, it could theoretically have a coefficient of 0.0 — meaning it takes no effort at all the push the object. The coefficient of friction can be greater than 1.0. (Imagine the object velcroed to the surface, for example.)

When μ equals 1 it takes as much effort to lift the object as to push it

When μ equals 0 pushing is effortless, from Eddie's notes.
So it would seem that having a good μ for a surface would make everything easy. The problem is that we don't really have an easy way of figuring out μ with absolute precision. There are two ways around this problem. You can drag the object with a force scale and divide that by the object's weight, or you can come up with some kind of gizmo to approximate everything.
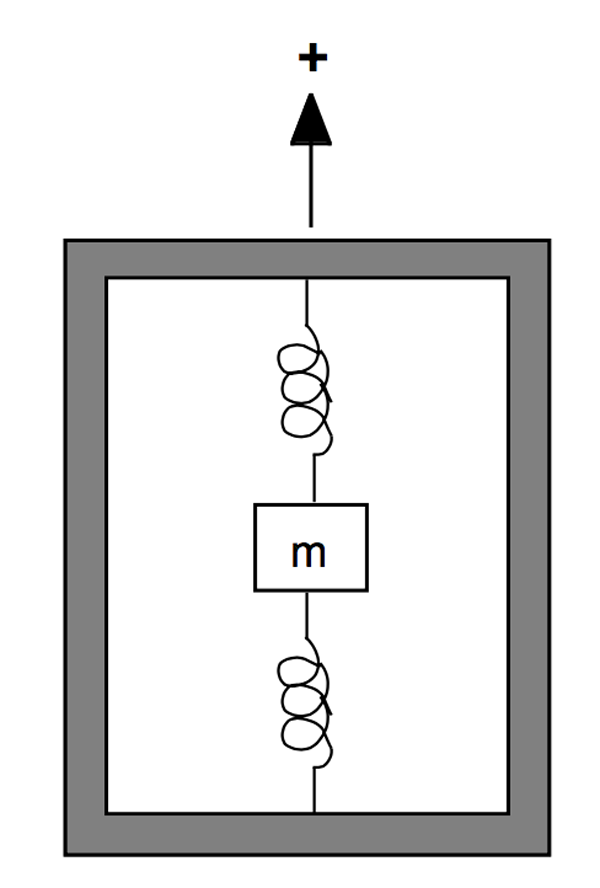
Simple accelerometer
As you can imagine these things can be less than accurate, though they have improved over the years. We pilots will not hear the term "Mu" (μ) from a U.S. facility because it has been excised from AIM and the Pilot-Controller Glossary. The following used to appear in the U.S. AIM:
- MU (friction) values range from 0 to 100 where zero is the lowest friction value and 100 is the maximum friction value obtainable. For frozen contaminants on runway surfaces, a MU value of 40 or less is the level when the aircraft braking performance starts to deteriorate and directional control begins to be less responsive. The lower the MU value, the less effective braking performance becomes and the more difficult directional control becomes.
- When the MU value for any one-third zone of an active runway is 40 or less, a report should be given to ATC by airport management for dissemination to pilots.
- No correlation has been established between MU values and the descriptive terms "good," "fair," "poor," and "nil" used in braking action reports.
Even back then, the U.S. Aeronautical Information Manual seemed to discount any connection between Mu and good/fair/poor/nil qualifiers and you hardly hear the term "mu" in the United States any more. But airport operators use it. How?
FAA-approved friction measuring equipment may be employed to help in determining the effects of friction-enhancing treatments, in that it can show the trend of a runway as to increasing or decreasing friction. Airport operators should not attempt to correlate friction readings (Mu numbers) to Good/Medium (previously known as Fair)/Poor or Nil runway surface conditions, as no consistent, usable correlation between Mu values and these terms has been shown to exist to the FAA’s satisfaction. It is important to note that while manufacturers of the approved friction measuring equipment may provide a table that correlates braking action to Mu values, these correlations are not acceptable to the FAA. To ensure that data collected are accurate, qualified personnel should use FAA-approved equipment and follow the manufacturer’s instructions for use. Note: It is no longer acceptable to report or disseminate friction (Mu) values to aircraft operators. This includes informal dissemination outside of the NOTAM system. In support of this change the NOTAM system will no longer allow for the reporting of this information. Airplane braking performance cannot be directly related to Friction (Mu) values. Runway Condition Codes, which will be included in the runway condition NOTAM, where applicable, are directly relevant to the determination of required landing distances.
Source: AC 150/5200-30D, ¶5.2
So the airport operator cannot report the Mu (μ) value to pilots or the NOTAM system, but they can use it when building their Runway Condition Codes.
Decelerometers
There are two basic types of friction measuring equipment that can be used for conducting friction surveys on runways during winter operations: Continuous Friction Measuring Equipment (CFME) and Decelerometers (DEC).
- Continuous Friction Measuring Equipment (CFME). CFME devices are recommended (over Decelerometers) for measuring friction characteristics of pavement surfaces covered with contaminants, as they provide a continuous graphic record of the pavement surface friction characteristics with friction averages for each one-third zone of the runway length.
- Decelerometers. Decelerometers are recommended (over CFMEs) for airports where the longer runway downtime required to complete a friction survey is unacceptable and for busy airports where it is difficult to gain access to the full length of a runway crossed by another runway. Decelerometers should be of the electronic type due to the advantages noted below. Mechanical decelerometers may be used, but should be reserved as a backup. Airports having only mechanical devices should plan to upgrade as soon as possible. Neither type of decelerometer will provide a continuous graphic record of friction for the pavement surface condition. They provide only a spot check of the pavement surface. On pavements with frozen contaminant coverage of less than 25 percent, decelerometers are used only on the contaminated areas. For this reason, a survey taken under such conditions will result in a conservative representation of runway braking conditions. This should be considered when using friction values as an input into decisions about runway treatments. In addition, any time a pilot may experience widely varying braking along the runway, it is essential that the percentage of contaminant coverage be noted in any report.
- Electronic decelerometers eliminate potential human error by automatically computing and recording friction averages for each one-third zone of the runway. They also provide a printed record of the friction survey data.
- Mechanical decelerometers may be used as a backup to an electronic decelerometer. The runway downtime required to complete a friction survey will be longer than with an electronic decelerometer. Mechanical decelerometers do not provide automatic friction averages or a printed copy of data.
Source: AC 150/5200-30D, ¶1.11
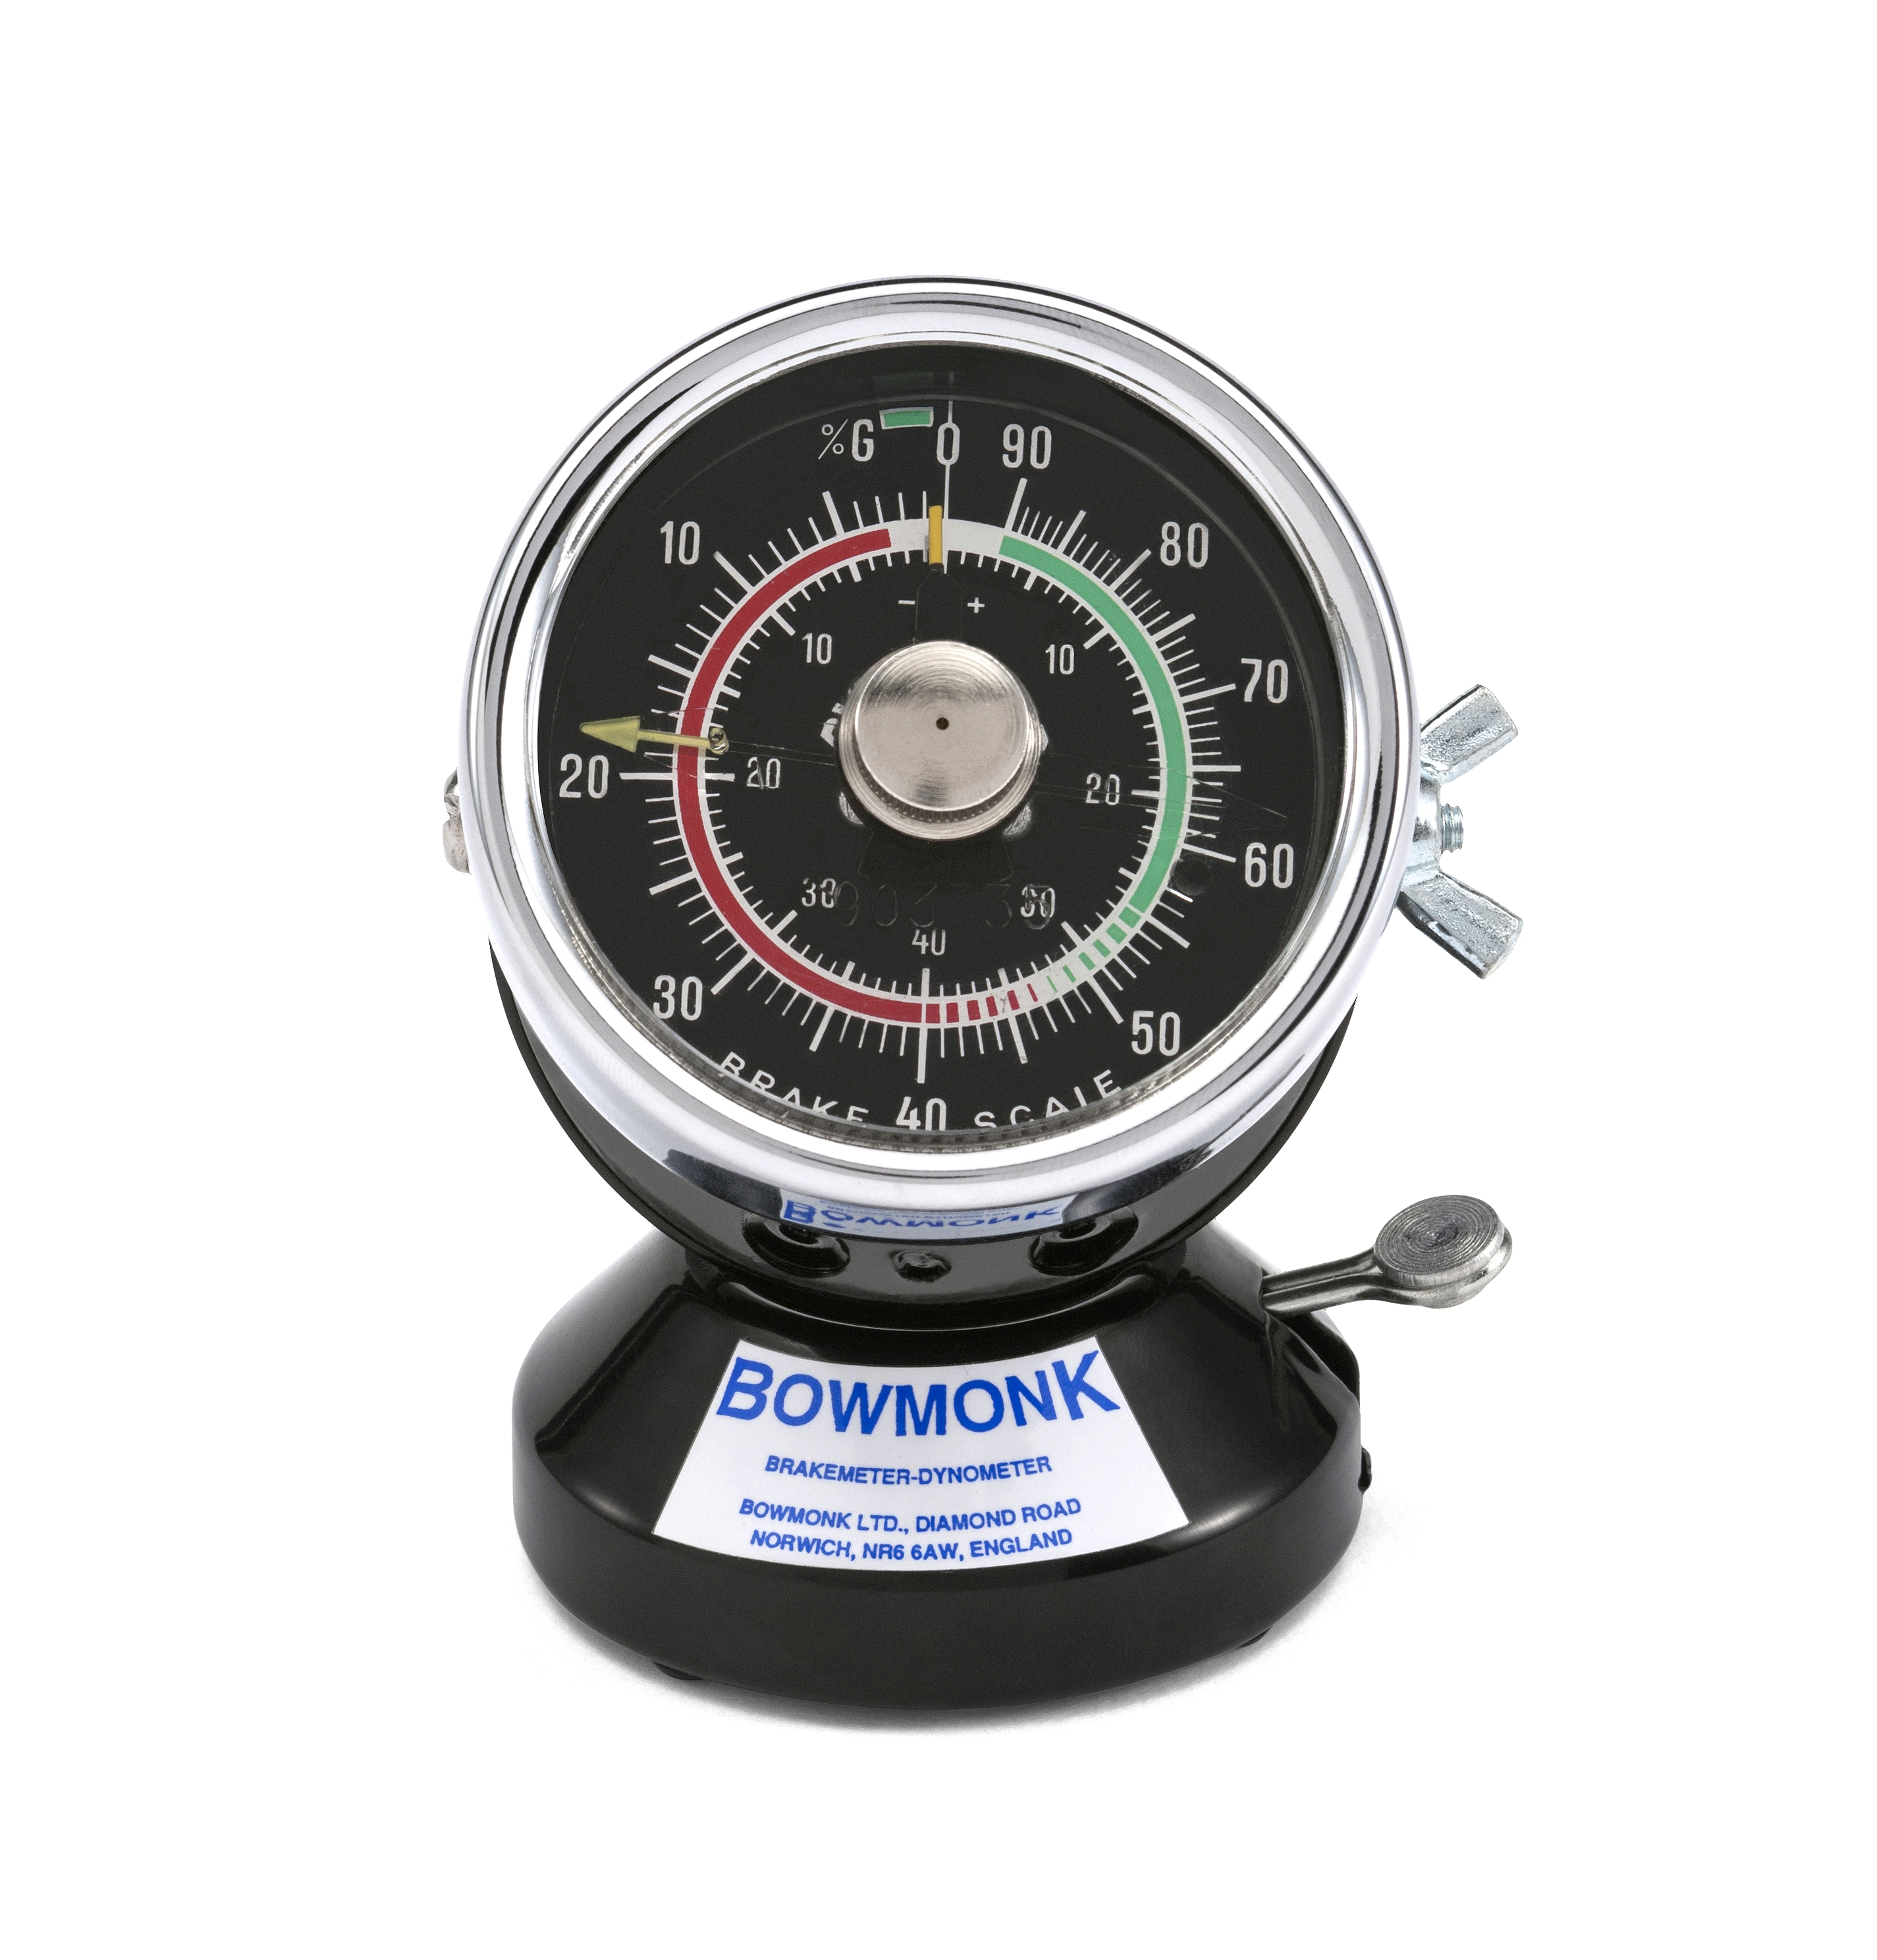
Bowmonk Meter 3, from http://www.bowmonk.com/
We used to do these as pilots in the Air Force at some northern bases. The unit is mounted in the vehicle so as to measure longitudinal deceleration. You fire up the vehicle to a certain speed and jam on the brakes. The way I recall it, you floored it until the speedometer was pegged going as fast as you can on a very slippery surface, and then stomped on the brakes and tried not to soil your pants. Just to be sure, I asked someone who does these for a living and he said they go to 20 mph. Some of the meters output Mu (μ) directly, others put out G-units that have to be converted using a table.
Asking around various airport managers, there is a lot of technique involved to get consistent results. But the system can put out reliable deceleration values to enter into their version of the RCAM table (shown below) with a μ value. But there is more to it than that.
Surface Evaluation
Lateral Location. On runways that serve primarily narrow-body airplanes, runway friction surveys should be conducted approximately 10 feet (3 m) from the runway centerline. On runways that serve primarily wide-body airplanes, runway friction surveys should be conducted approximately 20 feet (6 m) from the runway centerline. Unless surface conditions are noticeably different on the two sides of the runway centerline, only one survey is needed, and it may be conducted on either side.
Source: AC 150/5200-30D, ¶5.2.2.3.1
The RCAM is the method by which an airport operator reports a runway surface assessment when contaminants are present. Use of the RCAM is only applicable to paved runway surfaces. Once an assessment has been performed, the RCAM defines the format for which the airport operator reports and receives a runway condition “Code” via the NOTAM System. The reported information allows a pilot to interpret the runway conditions in terms that relate to airplane performance. This approach is a less subjective means of assessing runway conditions by using defined objective criteria. Aircraft manufacturers have determined that variances in contaminant type, depth, and air temperature can cause specific changes in aircraft braking performance. At the core of the RCAM is its ability to differentiate among the performance characteristics of given contaminants.
Source: AC 150/5200-30D, ¶5.3.1
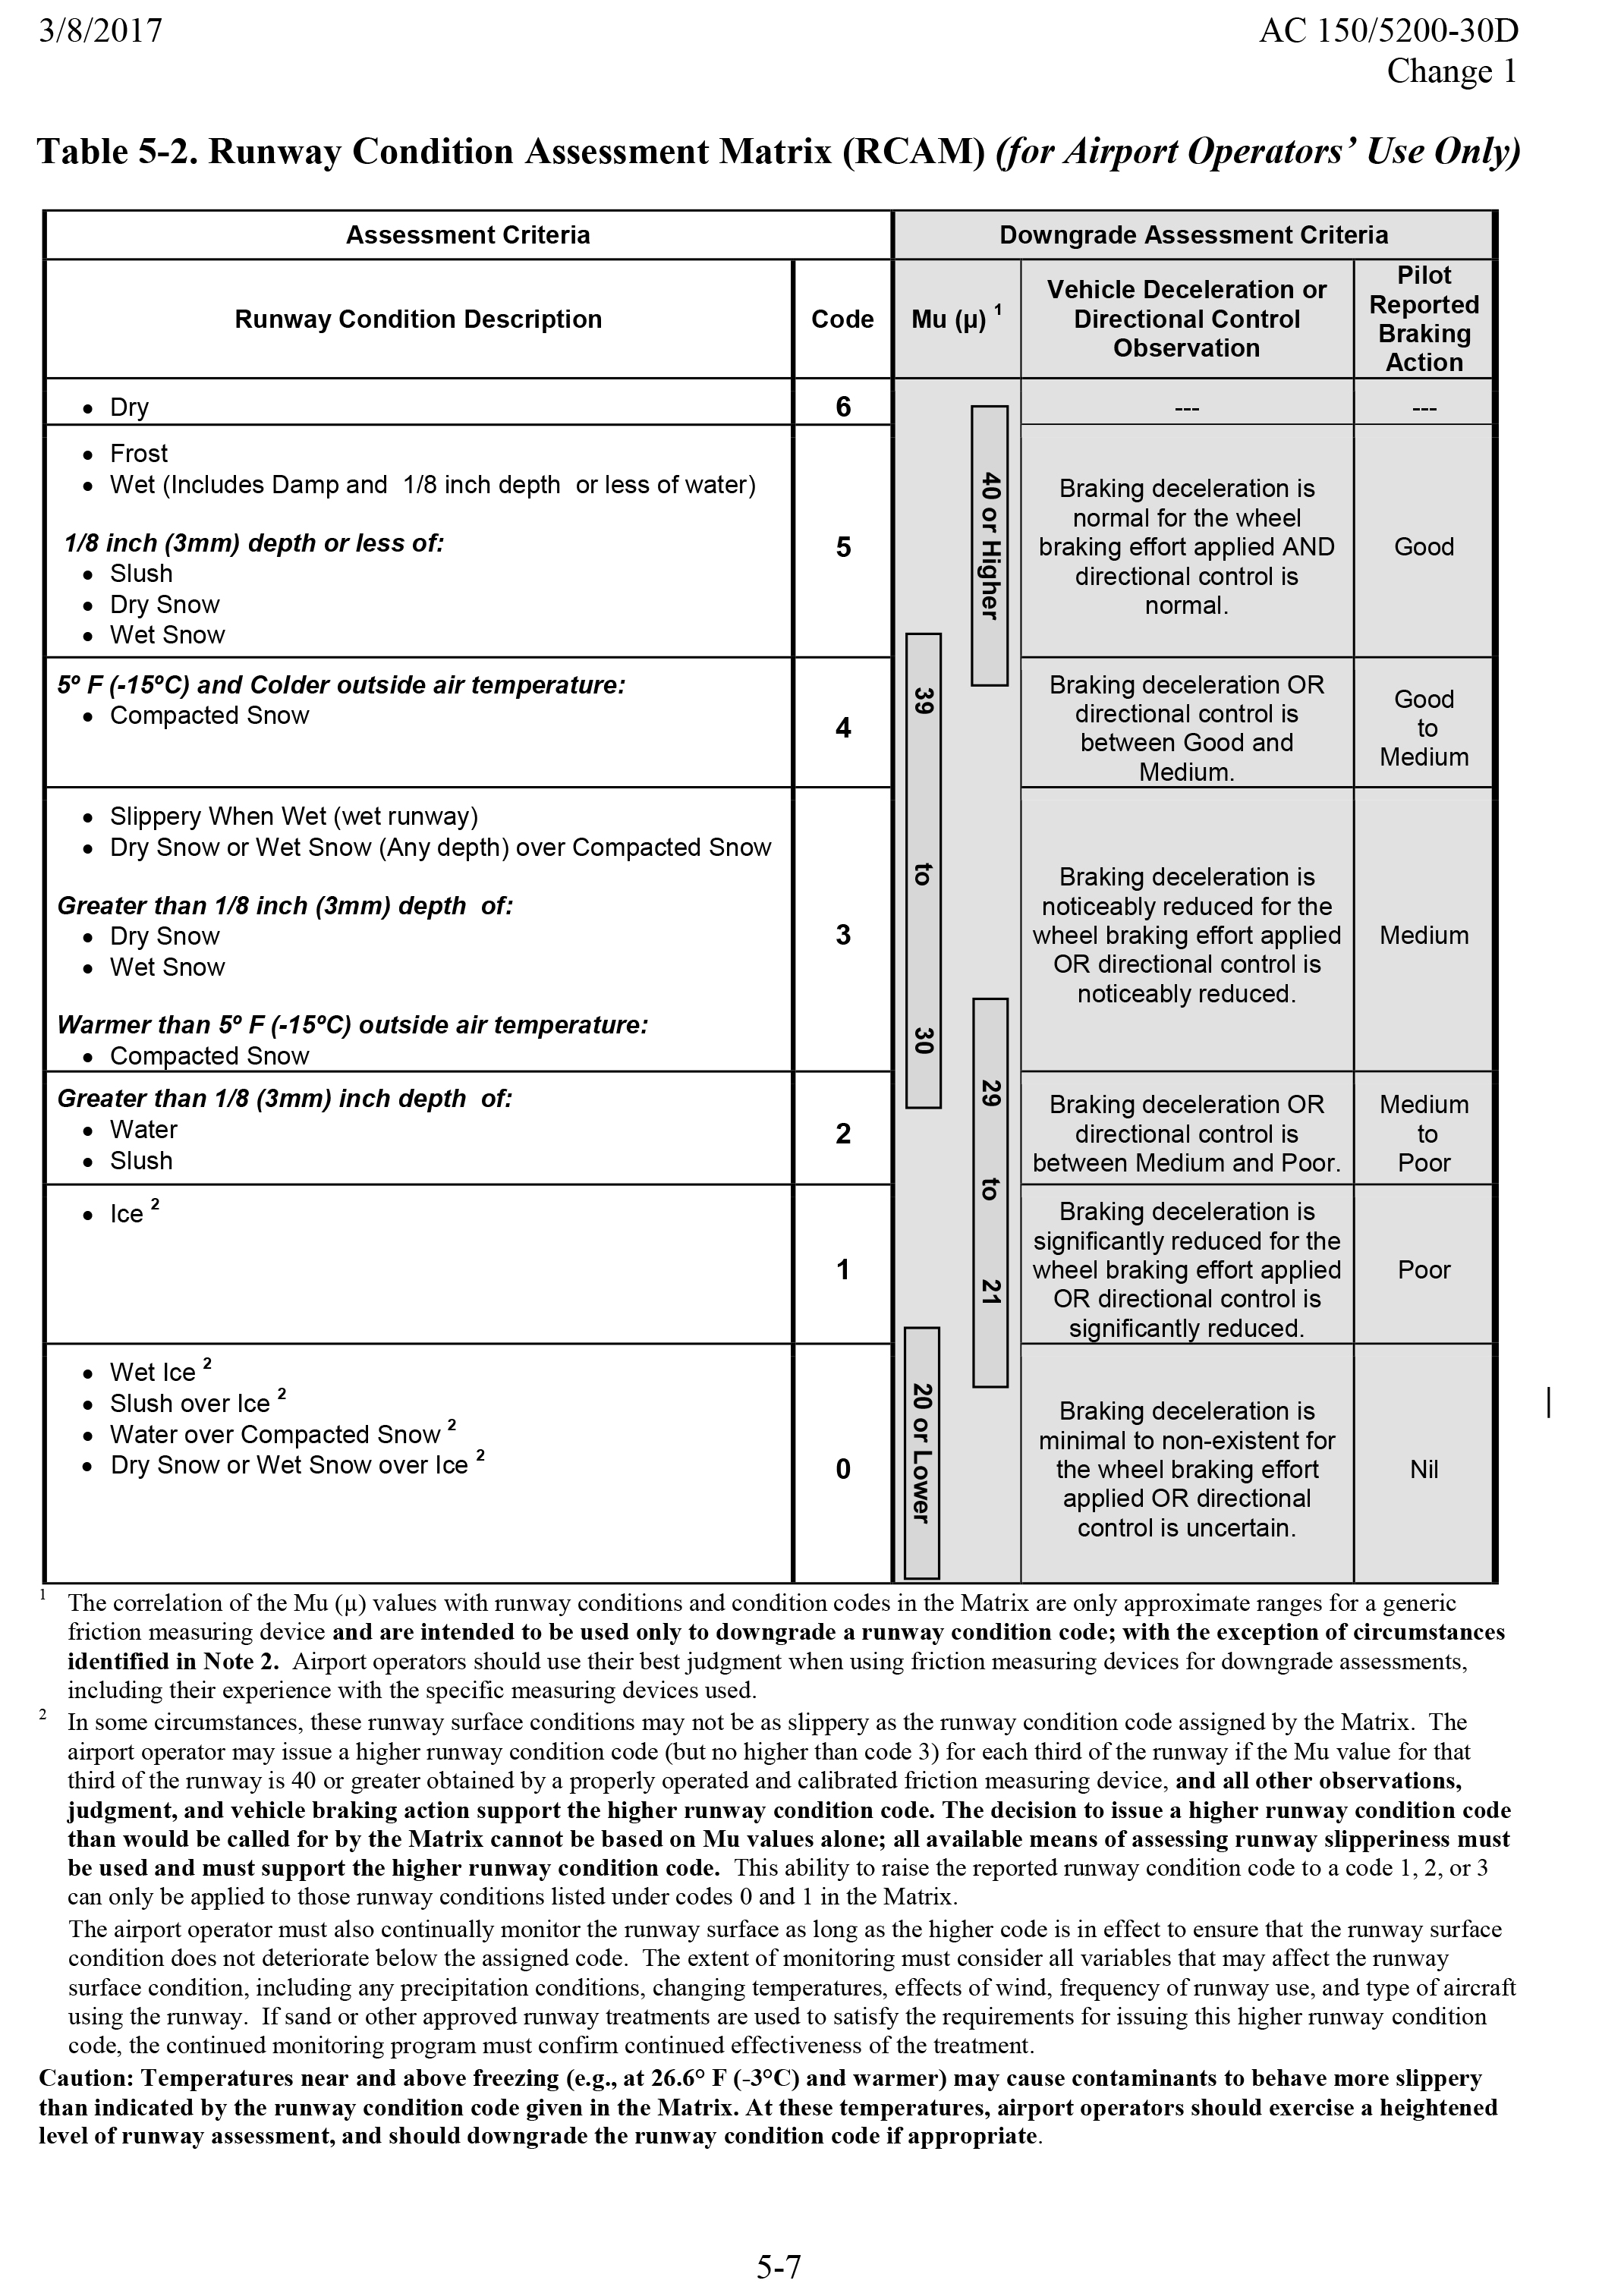
Runway Condition Assessment Matrix, AC 150/5200-30D, Table 5-2.
Conditions Acceptable to Use Decelerometers or Continuous Friction Measuring Equipment to Conduct Runway Friction Surveys on Frozen Contaminated Surfaces.
5.1.4.1. The data obtained from such runway friction surveys are considered to be reliable only when the surface is contaminated under any of the following conditions:
- Ice or wet ice. Ice that is melting or ice with a layer of water (any depth) on top. The liquid water film depth of .04 inches (1 mm) or less is insufficient to cause hydroplaning.
- Compacted snow at any depth.
- Dry snow 1 inch (25.4 mm) or less.
- Wet snow or slush 1/8 inch (3 mm) or less.
5.1.4.2. It is not acceptable to use decelerometers or continuous friction measuring equipment to assess any contaminants outside of these parameters.
Source: AC 150/5200-30D, ¶5.1.4
The RCAM is the method by which an airport operator reports a runway surface assessment when contaminants are present. Use of the RCAM is only applicable to paved runway surfaces. Once an assessment has been performed, the RCAM defines the format for which the airport operator reports and receives a runway condition “Code” via the NOTAM System. The reported information allows a pilot to interpret the runway conditions in terms that relate to airplane performance. This approach is a less subjective means of assessing runway conditions by using defined objective criteria.
Source: AC 150/5200-30D, ¶5.3.1
Airport operators normally access the system through the "NOTAM Manager" application. The first question will be "Is greater than 25% of the overall runway length and width, or cleared width (if not cleared from edge to edge), contaminated?" If the answer is no the only option will be to report contaminant percentage, type, and depth, when applicable, for each third of the runway, as well as any treatment. No Runway Condition Code is reported.
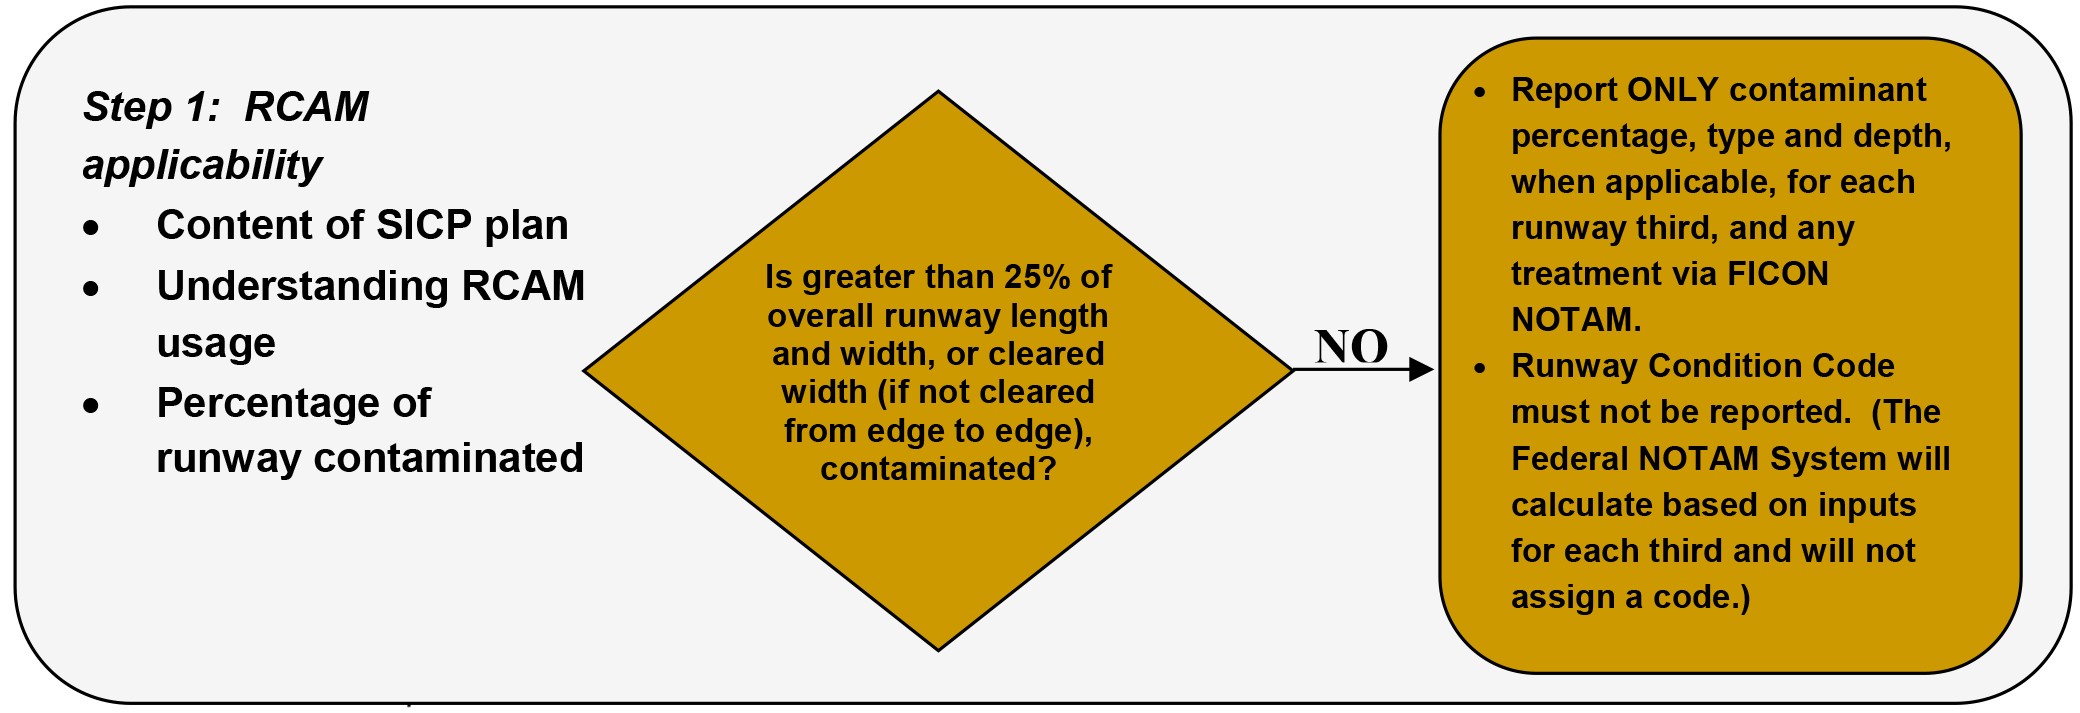
RCAM Process, Step 1, from AC 150/5200-30D, ¶5.3.2
So you've got more than 25% coverage. The next thing to do is look at the left column on the RCAM and look for the type and depth of contaminant as well as temperature. Do that for each third of the runway. If only a portion of the runway is cleared (such as the center 75'), you only have to consider that portion. Unless you have upgrades and downgrades, the Runway Condition Codes will enter the system. Notice you didn't have to do anything with the decelerometer.
RCAM Process, Step 2, from AC 150/5200-30D, ¶5.3.2
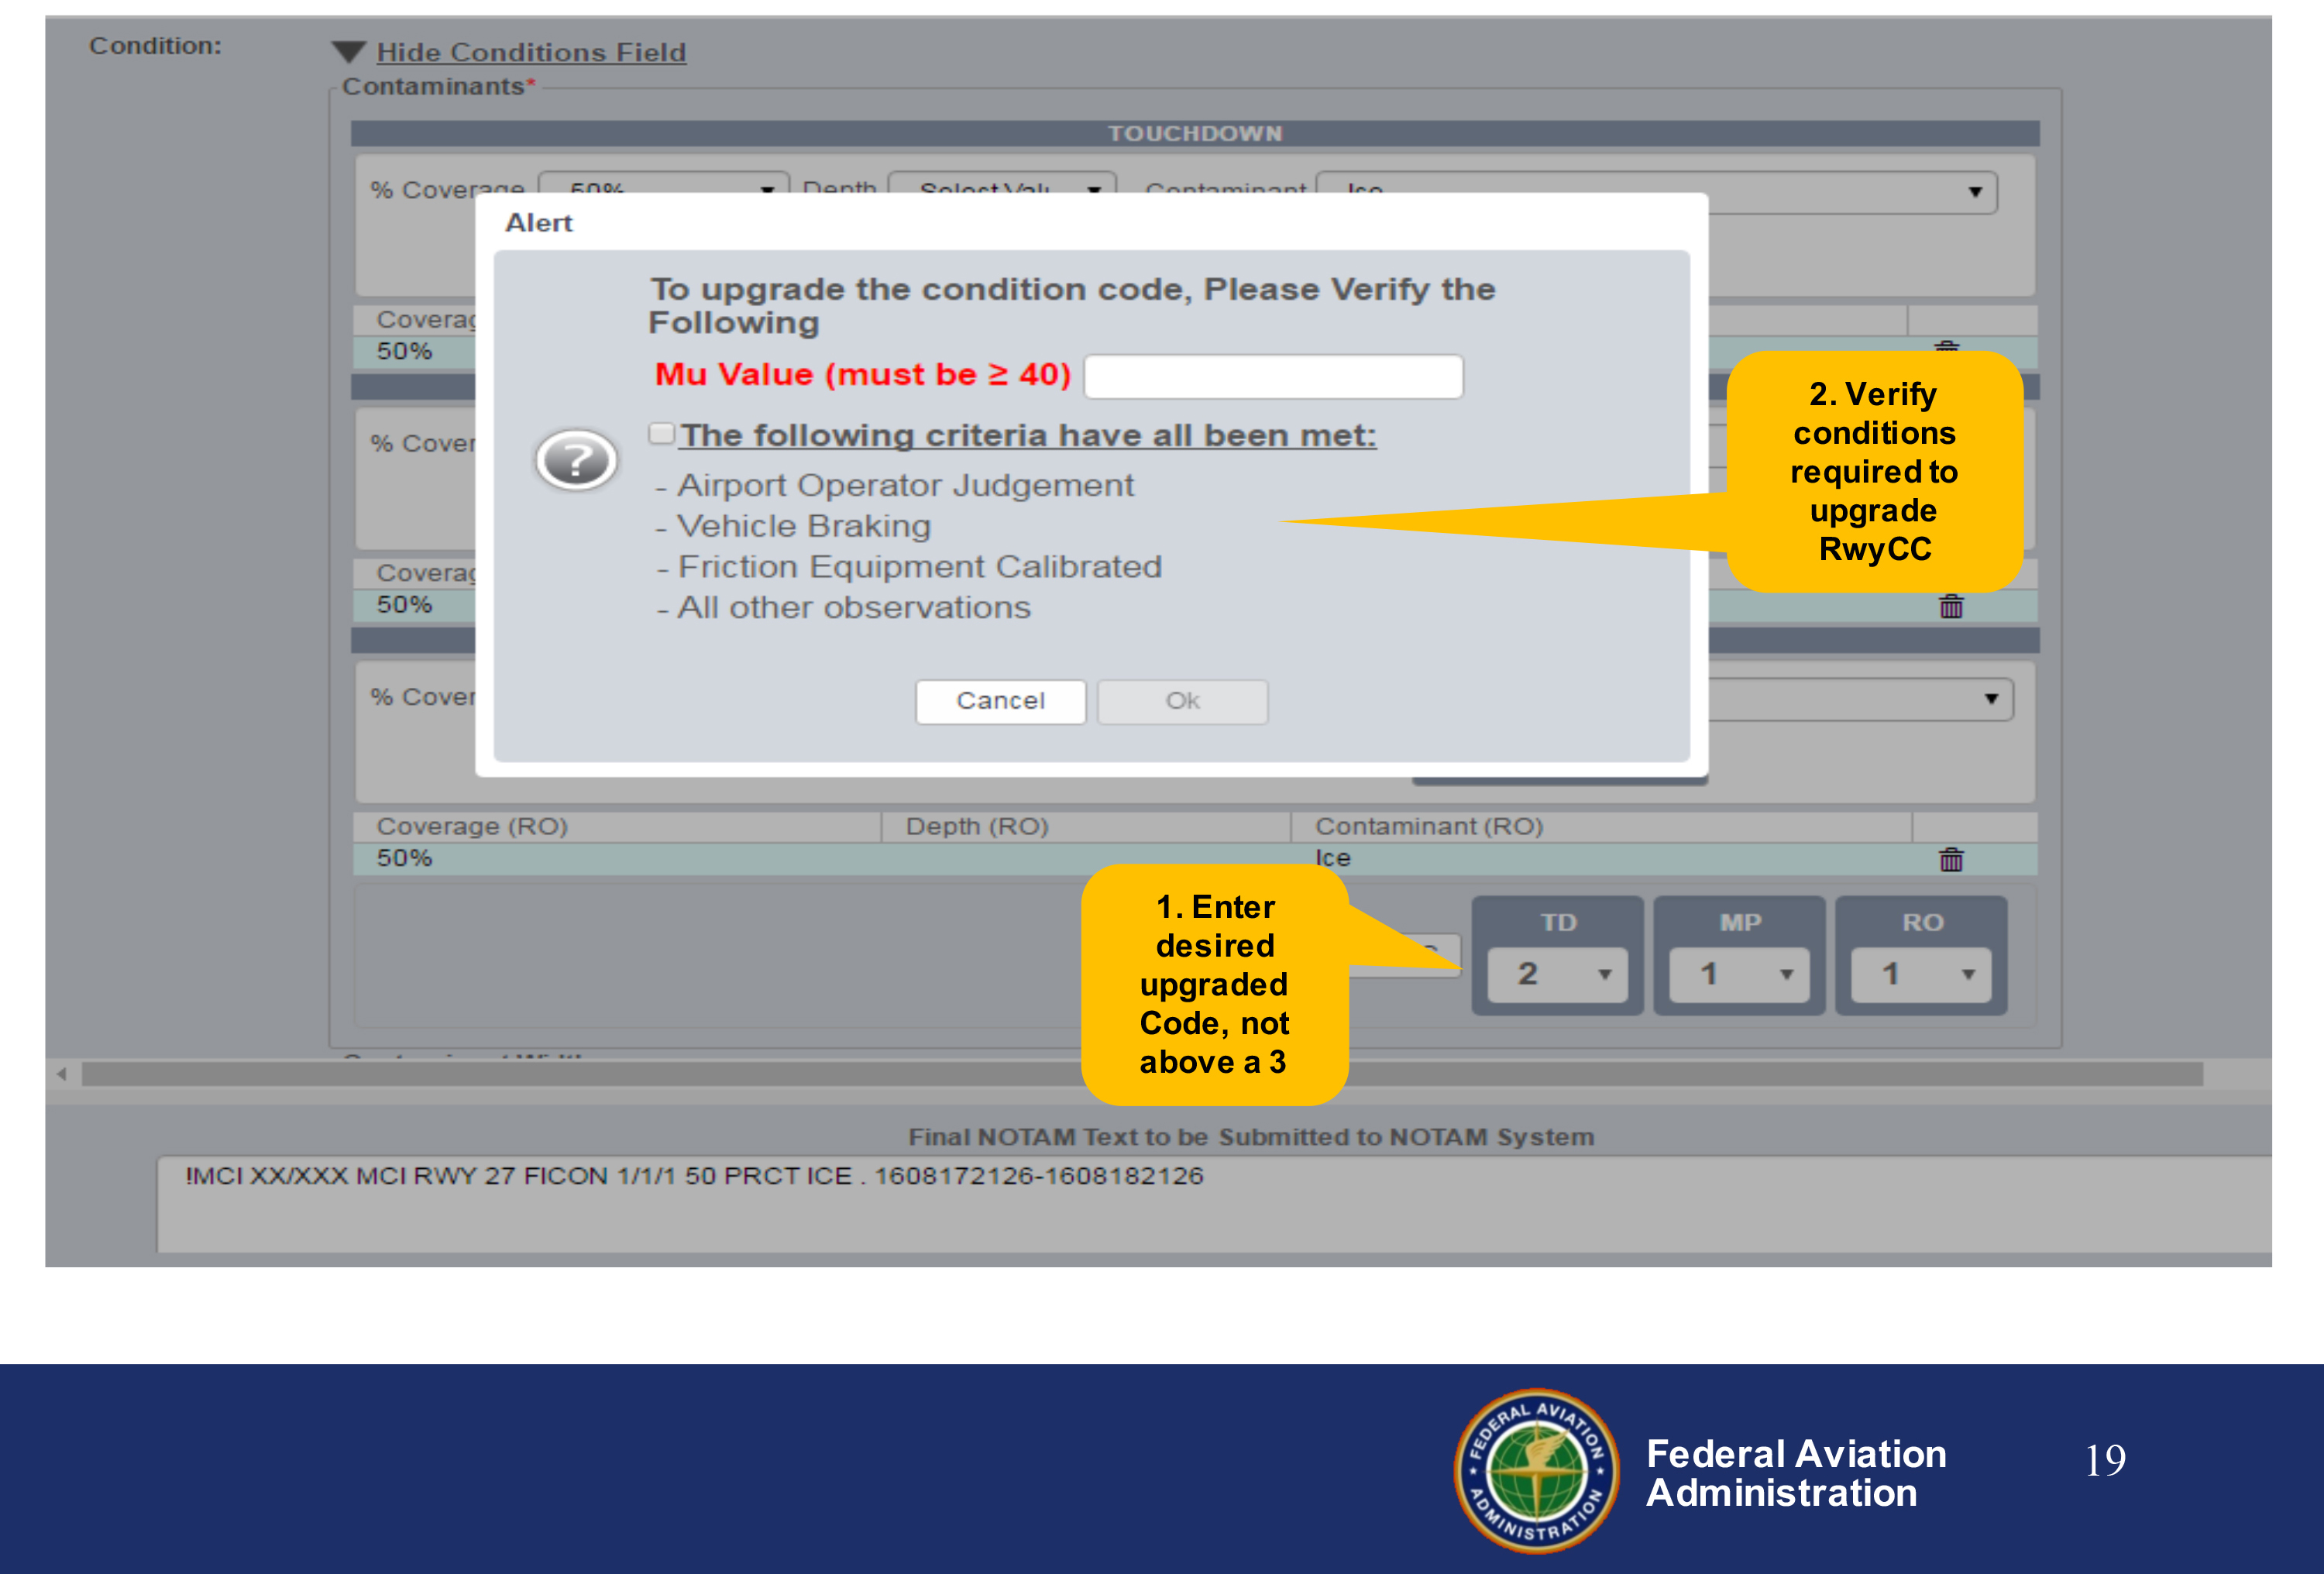
If the airport operator thinks the RCC can be upgraded or should be downgraded, they can take a drive with an approved decelerometer. But only RCCs of 1 or 2 can be upgraded and even then they can only be upgraded up to a 3. You can take the decelerometer's μ reading to upgrade or downgrade the RCC. What about pilot reports? Pilot reports can only be used to downgrade an RCC and only for the portion of the runway experienced.
RCAM Process, Step 3, from AC 150/5200-30D, ¶5.3.2
Downgrade Assessment Criteria. When data from the shaded area in the RCAM (i.e., CFME/deceleration devices, pilot reports, or observations) suggest conditions are worse than indicated by the present contaminant, the airport operator should exercise good judgment and, if warranted, report lower runway condition codes than the contamination type and depth would indicate in the RCAM. While pilot reports (PIREPs) of braking action provide valuable information, these reports rarely apply to the full length of the runway as such evaluations are limited to the specific sections of the runway surface in which wheel braking was utilized. It is not appropriate to use downgrade assessment criteria to upgrade contaminant based assessments of condition codes (e.g., from 2 to 3).
Source: AC 150/5200-30D, ¶5.3.3.2.
The correlation of the Mu (μ) values with runway conditions and condition codes in the RCAM are only approximate ranges for a generic friction measuring device and are intended to be used for an upgrade or downgrade of a runway condition code. Airport operators should use their best judgment when using friction measuring devices for downgrade assessments, including their experience with the specific measuring devices used.
Source: AC 150/5200-30D, ¶5.3.3.2.1
Vehicle Deceleration or Directional Control Observation. This column is used to correlate estimated vehicle braking experienced on a given contaminant.
Source: AC 150/5200-30D, ¶5.3.3.2.2
Pilot Reported Braking Action. This is a report of braking action on the runway, by a pilot, providing other pilots with a degree/quality of expected braking. The braking action experienced is dependent on the type of aircraft, aircraft weight, touchdown point, and other factors.
- Good: Braking deceleration is normal for the wheel braking effort applied, and directional control is normal.
- Good-to-Medium: Braking deceleration or directional control is between good and medium braking action.
- Medium: Braking deceleration is noticeably reduced for the wheel braking effort applied, or directional control is noticeably reduced.
- Medium-to-Poor: Braking deceleration or directional control is between medium and poor.
- Poor: Braking deceleration is significantly reduced for the wheel braking effort applied, or directional control is significantly reduced.
- Nil: Braking deceleration is minimal to non-existent for the wheel braking effort applied, or directional control is uncertain.
Source: AC 150/5200-30D, ¶5.3.3.2.3
6
Other braking condition reporting
There are a few other systems out there that you should know about. In fact, your Aircraft Flight Manual may depend on them.
Canadian Runway Friction Index (CRFI) Decelerometers
You would think that if anyone had a firm grasp on how to measure braking action on a contaminated runway, it would be the Canadians. The CRFI is a pretty good measure, the only real problem is some of the numbers are quite subjective. Dry snow on pavement can be anywhere from a "nil" to "dry." But it does give you another data point and it does have some science behind it.
Expected Range of CRFI by Surface Type, from TC AIM, Table 4a.
Many airports throughout Canada are equipped with mechanical and electronic decelerometers which are used to obtain an average of the runway friction measurement. The average decelerometer reading of each runway is reported as the Canadian Runway Friction Index (CRFI). Experience has shown that results obtained from the various types of decelerometers on water and slush are not accurate, and the CRFI will not be available when these conditions are present.
Source: Transport Canada Aeronautical Information Manual, ¶1.1.4
Runway friction tester, from ICAO Doc 9137, Part 2, figure 5-6.
Canada is one of the few countries that has stepped up to the plate and tried to quantify runway friction values and their impact on runway performance. More about this: Runway Friction. Even if the airport you are using doesn't have these decelerometers, the CRFI can be of use to you.
ICAO SNOWTAMs
The ICAO solution to measuring runway friction comes from a very long time ago and had been considered the standard for a very long time because it had numbers and a decimal place! It had to be good!
SNOWTAM Format, from ICAO Annex 15 Appendix 2.
A SNOWTAM is a "Special Series NOTAM"
Information concerning snow, slush, ice and standing water on aerodrome/heliport pavements shall, when reported by means of a SNOWTAM, contain the information in the SNOWTAM Format in Appendix 2.
Source: ICAO Annex 15] ¶5.2.3
It looks suspiciously like the "Mu" (μ) system the U.S. gave up on. See Mu (μ), above.
USAF Runway Condition Reading
Our Air Force flight manual charts had performance numbers with Runway Condition Readings (RCR). An RCR of 23 was considered dry, 9 was wet, and 4 was icy. The exact number tends to change a few points here and there, but those are close. If you are at an airport with military airplanes, they might just have an RCR for you. Can you enter your chart with an RCR? Probably not. But it is more information than you had before you asked.
USAF has established RCR procedures for determining the average deceleration readings of runways under conditions of water, slush, ice, or snow. The use of RCR code is dependent upon the pilot's having a stopping capability chart specifically applicable to his/her aircraft. USAF offices furnish RCR information at airports serving USAF and ANG aircraft.
Source: U.S. FAA Order JO 7110.10W §4-4-3 ¶11
7
Grooved runways
You may have heard that you can assume a wet runway that is grooved is "effectively dry." In fact, the EU says just that. (See the section on contamination defined, above. You may have also heard that you cannot. (As applied by many aircraft manufacturers.) As usual, there are caveats for both crowds. If you are taking credit, you should know that a wet runway is not always "effectively dry." If you aren't taking credit, you should realize that there are times when it is. Confused? Read on. . .
The definitive study on grooved runways was done in 1968 by the NASA Langley Research Center. Regardless of how your aircraft manuals stand on the subject of grooved runways, the results of the study should impact how you interpret the charts in those manuals.
Test aircraft, from Pavement Grooving and Traction Studies, page 121, figure 2.
The bottom line of those tests:
- Landing distances on a wet, grooved runway are remarkably reduced almost to the point of being dry, until the water depth is greater than 0.1 inch or if there is any slush. At that point the distances are improved but not nearly as much.
- Balanced field lengths are "essentially dry" for grooved runways in a "wet and puddled" condition. If the runway is slush covered, the advantages of runway grooves are only "slight."
For more about this: Grooved Runways.
8
Pre-departure decision making
If you are a commercial operator, you need to consider your landing distance at your planned destination before you takeoff. That includes the impact of a less than dry runway based on the weather predictions existing when you leave. Then you need to apply a factor to that. How much of a factor? It depends.
If you are not a commercial operator, your pre-departure considerations are the same as shown below, in En Route Decision Making.
Landing distance factors, AC 91-79A, App 2, fig. 2
U.S.
Large transport category airplanes: Turbine engine powered: Landing limitations: Destination airports.
(b) Except as provided in paragraph (c), (d), (e), or (f) of this section, no person operating a turbine engine powered large transport category airplane may take off that airplane unless its weight on arrival, allowing for normal consumption of fuel and oil in flight (in accordance with the landing distance in the Airplane Flight Manual for the elevation of the destination airport and the wind conditions expected there at the time of landing), would allow a full stop landing at the intended destination airport within 60 percent of the effective length of each runway described below from a point 50 feet above the intersection of the obstruction clearance plane and the runway. For the purpose of determining the allowable landing weight at the destination airport the following is assumed:
(1) The airplane is landed on the most favorable runway and in the most favorable direction, in still air.
(2) The airplane is landed on the most suitable runway considering the probable wind velocity and direction and the ground handling characteristics of the airplane, and considering other conditions such as landing aids and terrain.
(c) A turbopropeller powered airplane that would be prohibited from being taken off because it could not meet paragraph (b)(2) of this section, may be taken off if an alternate airport is selected that meets all of this section except that the airplane can accomplish a full stop landing within 70 percent of the effective length of the runway.
(d) Unless, based on a showing of actual operating landing techniques on wet runways, a shorter landing distance (but never less than that required by paragraph (b) of this section) has been approved for a specific type and model airplane and included in the Airplane Flight Manual, no person may take off a turbojet airplane when the appropriate weather reports or forecasts, or any combination of them, indicate that the runways at the destination airport may be wet or slippery at the estimated time of arrival unless the effective runway length at the destination airport is at least 115 percent of the runway length required under paragraph (b) of this section.
(e) A turbojet airplane that would be prohibited from being taken off because it could not meet paragraph (b)(2) of this section may be taken off if an alternate airport is selected that meets all of paragraph (b) of this section.
(f) An eligible on-demand operator may take off a turbine engine powered large transport category airplane on an on-demand flight if all of the following conditions exist:
(1) The operation is permitted by an approved Destination Airport Analysis in that person's operations manual.
(2) The airplane's weight on arrival, allowing for normal consumption of fuel and oil in flight (in accordance with the landing distance in the Airplane Flight Manual for the elevation of the destination airport and the wind conditions expected there at the time of landing), would allow a full stop landing at the intended destination airport within 80 percent of the effective length of each runway described below from a point 50 feet above the intersection of the obstruction clearance plane and the runway. For the purpose of determining the allowable landing weight at the destination airport, the following is assumed:
(i) The airplane is landed on the most favorable runway and in the most favorable direction, in still air.
(ii) The airplane is landed on the most suitable runway considering the probable wind velocity and direction and the ground handling characteristics of the airplane, and considering other conditions such as landing aids and terrain.
(3) The operation is authorized by operations specifications.
Source: 14 CFR 135, ¶135.385
Note: There is similar language for Part 121 operators in 14 CFR 121.195. There also is similar language for Part 91K operators in 14 CFR 91.1037 which basically reads the same but with a 80% factor.
EASA
The mass of the aeroplane:
- at the start of the take-off; or
- in the event of in-flight replanning, at the point from which the revised operational flight plan applies,
shall not be greater than the mass at which the requirements of the appropriate chapter can be complied with for the flight to be undertaken. Allowance may be made for expected reductions in mass as the flight proceeds and for fuel jettisoning.
Source: EASA Air Ops Annex 1 to VIII, §ANNEX IV, ¶CAT.POL.A.105 (a)
The landing mass of the aeroplane determined in accordance with CAT.POL.A.105(a) for the estimated time of landing at the destination aerodrome and at any alternate aerodrome shall allow a full stop landing from 50 ft above the threshold:
- for turbo-jet powered aeroplanes, within 60 % of the landing distance available (LDA); and
- for turbo-propeller powered aeroplanes, within 70 % of the LDA.
Source: EASA Air Ops Annex 1 to VIII, §ANNEX IV, ¶CAT.POL.A.230 (a)
For dispatching the aeroplane it shall be assumed that:
- the aeroplane will land on the most favourable runway, in still air; and
- the aeroplane will land on the runway most likely to be assigned, considering the probable wind speed and direction, the ground handling characteristics of the aeroplane and other conditions such as landing aids and terrain.
Source: EASA Air Ops Annex 1 to VIII, §ANNEX IV, ¶CAT.POL.A.230 (e)
9
En route decision making
A few things change once you are wheels in the well and en route to your destination. First of all, those commercial landing factors that must be considered prior to departure go away. Second, the requirement for recency of the weather reports changes. Finally, other planning factors need to be added.
Weather
These distances are advisory performance data (i.e., not required by regulation) intended to provide a more accurate assessment of actual landing distance at time of arrival, considering factors that cannot be accurately predicted at time of preflight, such as runway contaminants, winds, speed additives, and touchdown points. These distances may be based upon the use of reverse thrust, ground spoilers, autobrakes, etc.
Source: SAFO 19003, Landing Distance at Time of Arrival
For the purpose of this guidance, Time of Arrival is a point in time close enough to the airport to allow the crew to obtain the most current meteorological and runway surface conditions considering pilot workload and traffic surveillance, but no later than the commencement of the approach procedures or visual approach pattern.
Source: SAFO 19003, At Time of Arrival
An assessment is initially performed when landing weather and field conditions are obtained, usually around Top of Descent (TOD). It is important to note the time of the latest Field Condition report and any associated reliable braking action reports. A number of overruns have occurred when pilots were provided with a runway condition that was no longer reliable given changes in meteorological conditions. Pilots are strongly advised to review the weather conditions and compare that to the time of the latest braking action report. The assessment should include consideration of how much deterioration in field conditions can be tolerated, the minimum RwyCC(s), and Field Condition (FICON) or Braking Action Reports needed to safely land, should those factors deteriorate from the ones used in the TOD landing distance.
Source: SAFO 19003, Timeliness
IN-FLIGHT DETERMINATION OF THE LANDING DISTANCE. The in-flight determination of the landing distance should be based on the latest available meteorological or runway state report, preferably not more than 30 minutes before the expected landing time.
Source: EASA Air Ops Annex 1 to VIII, §ANNEX IV, ¶CAT.OP.MPA.300
Factors — Commercial Operators
Unless, based on a showing of actual operating landing techniques on wet runways, a shorter landing distance (but never less than that required by [the dry runway rules] of this section) has been approved for a specific type and model airplane and included in the Airplane Flight Manual, no person may take off a turbojet airplane when the appropriate weather reports or forecasts, or any combination of them, indicate that the runways at the destination airport may be wet or slippery at the estimated time of arrival unless the effective runway length at the destination airport is at least 115 percent of the runway length required under [the dry runway rules] of this section.
Source: 14 CFR 121, §121.195(d)] and [14 CFR 135, §135.385(d)
- 7.2.1. When the appropriate weather reports or forecasts or a combination thereof indicate that the runway at the estimated time of arrival may be wet, the landing distance available should be at least 115 per cent of the required landing distance determined in accordance with [dry runway conditions].
- A landing distance on a wet runway shorter than that required by 7.2.1 but not less than that required by [dry runway conditions] may be used if the flight manual includes specific additional information about landing distance on wet runways.
Source: ICAO Annex 6, Part 1, Att C, Page C-7
Part 1 of Annex 6 applies to commercial aircraft and basically says you will use 115% of dry runway data unless your flight manual gives you data that allows a smaller factor. There does not appear to be a similar requirement for general aviation aircraft.
Landing — wet and contaminated runways.
- When the appropriate weather reports and/or forecasts indicate that the runway at the estimated time of arrival may be wet, the LDA shall be at least 115 % of the required landing distance, determined in accordance with CAT.POL.A.230.
- When the appropriate weather reports and/or forecasts indicate that the runway at the estimated time of arrival may be contaminated, the LDA shall be at least the landing distance determined in accordance with (a), or at least 115 % of the landing distance determined in accordance with approved contaminated landing distance data or equivalent, whichever is greater. The operator shall specify in the operations manual if equivalent landing distance data are to be applied.
- A landing distance on a wet runway shorter than that required by (a), but not less than that required by CAT.POL.A.230(a), may be used if the AFM includes specific additional information about landing distances on wet runways.
- A landing distance on a specially prepared contaminated runway shorter than that required by (b), but not less than that required by CAT.POL.A.230(a), may be used if the AFM includes specific additional information about landing distances on contaminated runways.
- For (b), (c) and (d), the criteria of CAT.POL.A.230 shall be applied accordingly, except that CAT.POL.A.230(a) shall not be applied to (b) above.
Source: EASA Air Ops Annex 1 to VIII, §ANNEX IV, ¶CAT.POL.A.235
Factors — Fractional Operators
Unless, based on a showing of actual operating landing techniques on wet runways, a shorter landing distance (but never less than that required by [dry runway rules] of this section) has been approved for a specific type and model airplane and included in the Airplane Flight Manual, no person may take off a turbojet airplane when the appropriate weather reports or forecasts, or any combination of them, indicate that the runways at the destination or alternate airport may be wet or slippery at the estimated time of arrival unless the effective runway length at the destination airport is at least 115 percent of the runway length required under [dry runway rules] of this section.
Source: 14 CFR 91, §91.1037(e)
This applies only the 14 CFR 91 Subpart K Fractional Operators.
Factors — Part 91
Preflight planning requirements for part 91 operators are governed by §§ 91.103 and 91.605. It is highly recommended that part 91 operators and pilots calculate predeparture landing distance performance requirements based on the guidance contained in their AFM, and employ the landing assessment process before initiating the approach landing phase of the flight, and consider the factors presented in this AC to avoid a runway overrun.
Source: AC 91-79A, appendix 2, ¶2.a.] Part 91 Operational Recommendations.
To ensure that an acceptable landing distance safety margin exists at time of arrival (TOA), the FAA recommends a 15-percent safety margin be applied to the actual airplane landing distance. The 15-percent safety margin is a minimum safety margin to be applied after accounting for all known variables, such as the meteorological conditions, runway surface conditions, landing with a tailwind, airplane configuration and weight, runway slope, threshold crossing height and airspeed, and the timely utilization of ground deceleration devices. Be prepared, know the landing conditions, divert to an alternate, or go-around, but do not risk a runway overrun.
Conclusion
There isn't a lot of regulatory guidance to deal with runway contamination, other than to say add 15% on a wet runway if you are a commercial operator. If the manufacturer provided better guidance, you can use that instead. But even after you've done all that, there is more . . .
10
Safety factor
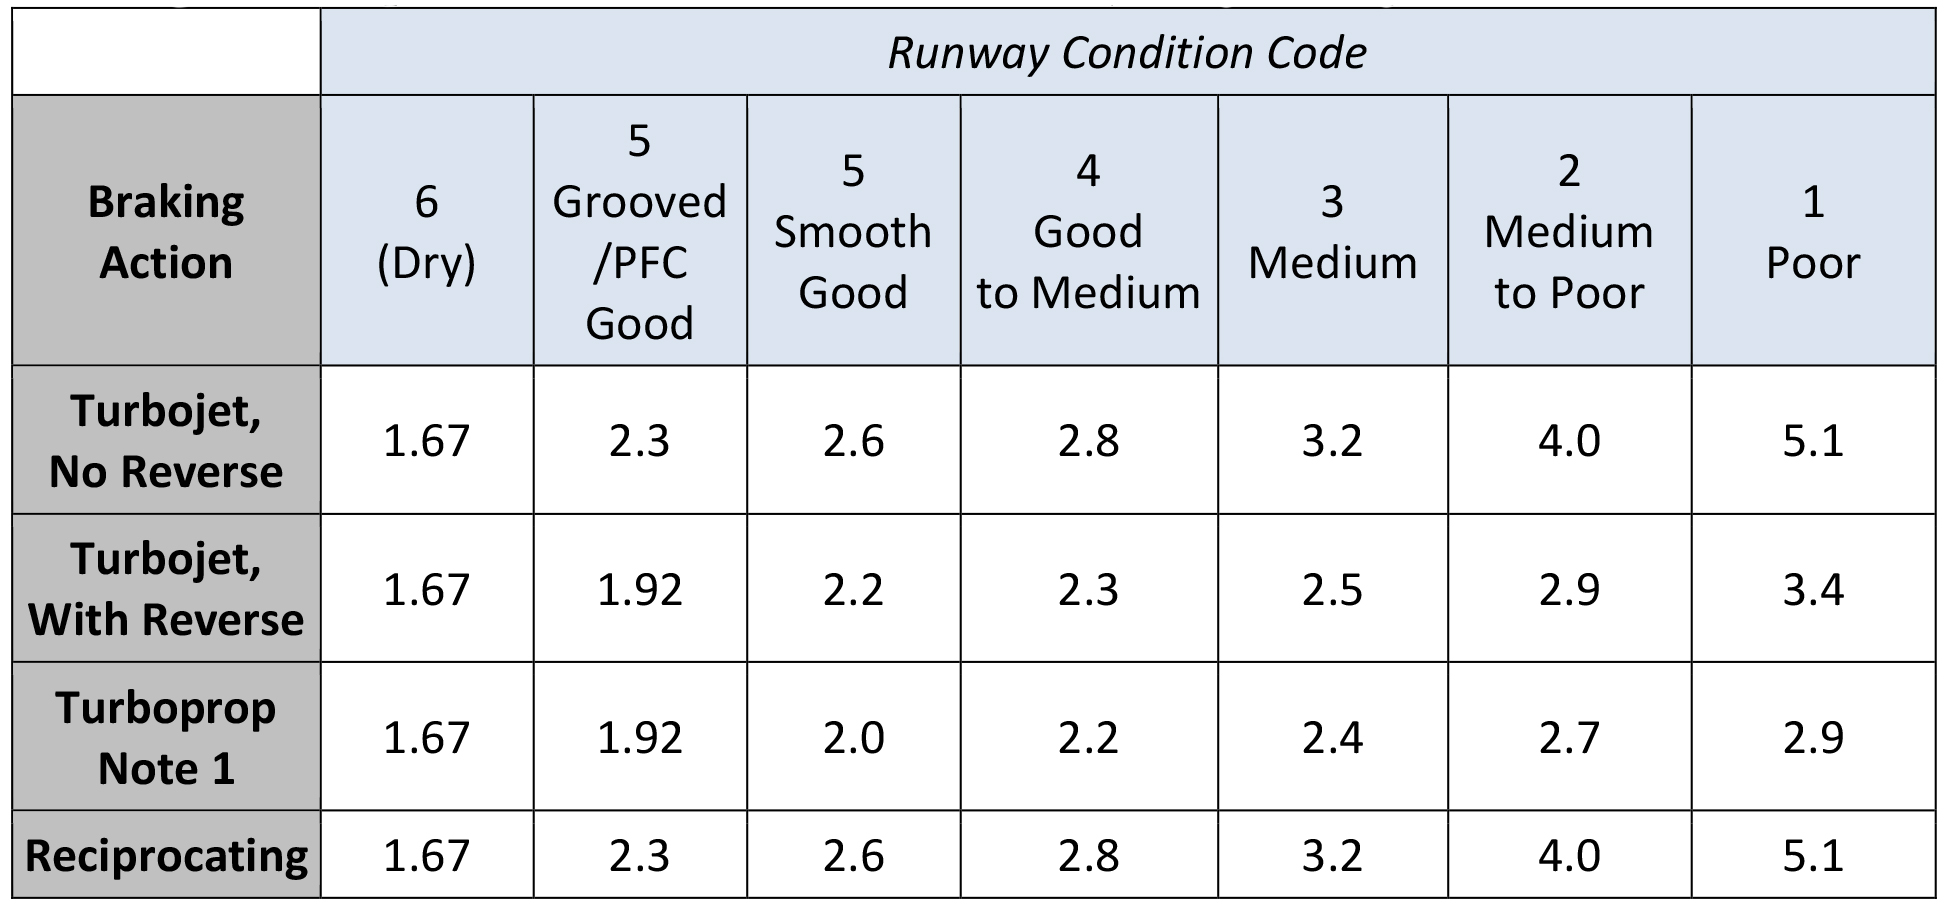
The 2005 accident of Southwest Airlines 1248 inspired Safety Alert For Operators (SAFO) 06012 and a new set of guidelines for commercial operators. That SAFO basically told you to compute your landing distance based on the conditions you expect, then add 15%. That guidance has been replaced by SAFO 19001, which applies to all operators (even Part 91), and give us this table:
Landing distance factors, SAFO 19001, Table 1.
Note 1: These LDFs apply only to turboprops where the AFM provides for a landing distance credit for the use of ground idle power lever position. Turboprops without this credit should use the Turbojet, No Reverse LDFs.
Do you have to use these factors? Not if your manufacturer or other performance data provider gives you something else:
If advisory data for a landing distance assessment at time-of-arrival is not available from the manufacturer, performance provider data may be used. If performance-provider data is not available, the landing distance factors (LDF) from Table 1, Landing Distance Factors, may be used. To find the Landing Distance Required (LDR), multiply the certificated (i.e., AFM dry, unfactored) Landing Distance by the applicable LDF in Table 1 for the runway conditions existing at the time of arrival. If the AFM landing distances are presented as factored landing distances, then those data must be adjusted to remove the applicable preflight factors applied to that data. The LDFs given in Table 1 include a 15 percent safety margin, an air distance representative of normal operational practices, a reasonable accounting for temperature, the effect of increased approach speed, reduced wheel braking, reverse thrust usage (or not), the additional effect of reduced wheel braking capability on altitude and wind distance adjustment.
Source: SAFO 19001
11
Pilot procedures: the flare
We know intuitively that the landing flare consumes distance but something inside us also says that must have been accounted for in the aircraft certification. Well, it was. But it may not be the same idea of a flare as you might think. Remember the guys certifying the airplane are trying to show how the airplane can use short runways so they can sell more of them. Your objective is different. All of this is of critical importance when trying to predict our airplane's braking performance.
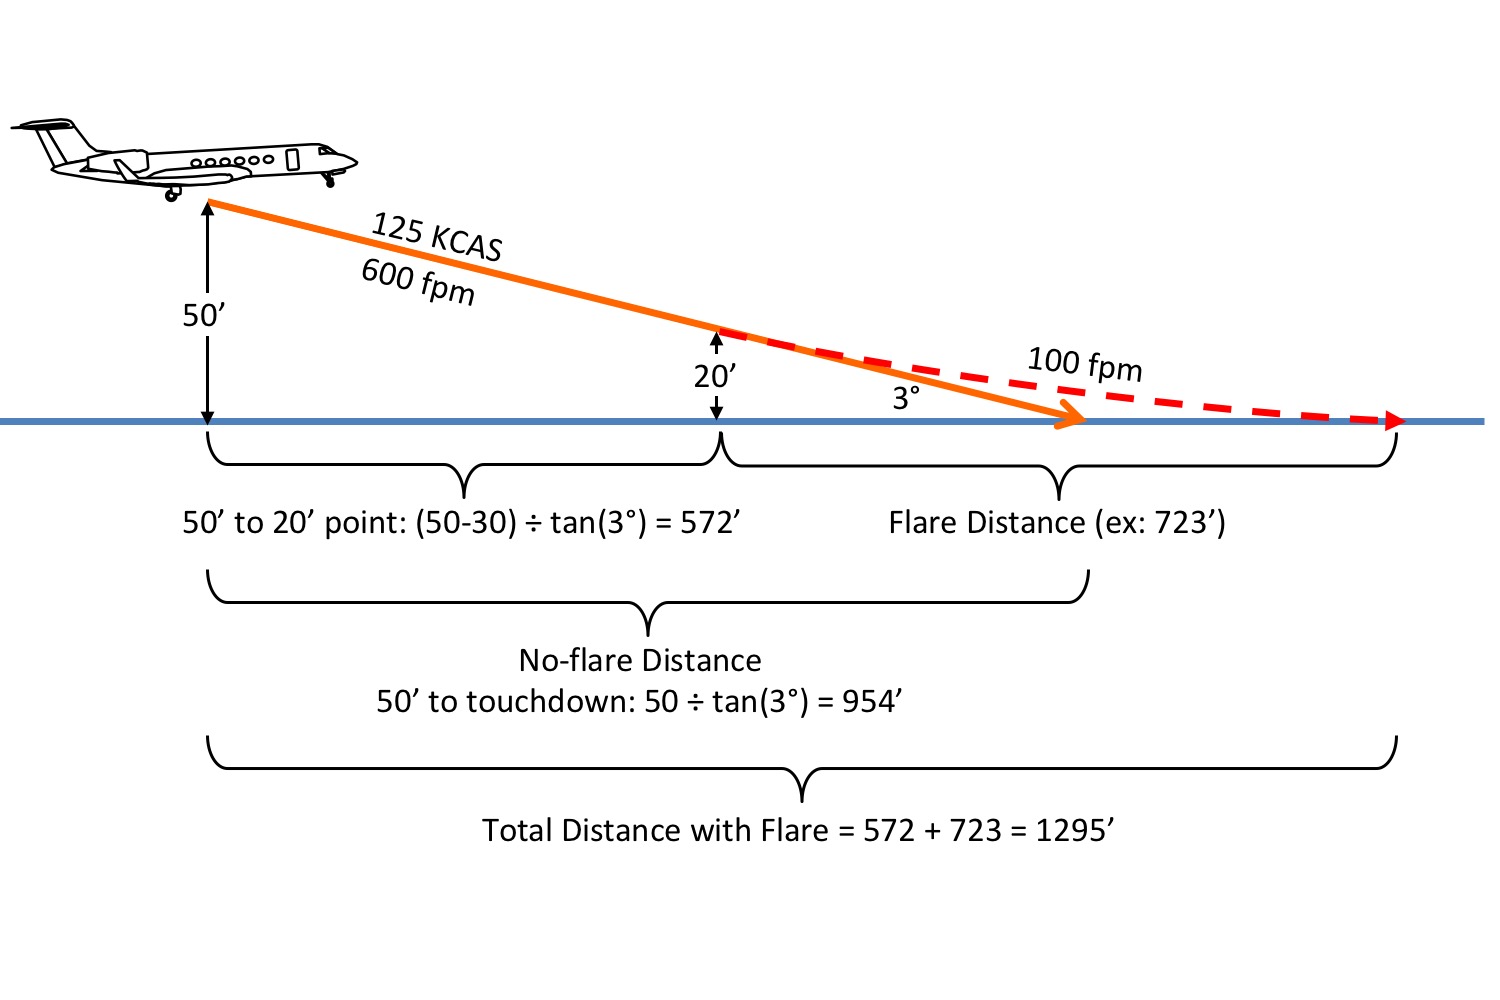
Example landing flare math, from Aim Point vs. Touchdown Point.
So how do we translate that from math-speak to pilot-speak? I have long advocated that the flare should be a continuous pull of four seconds from the approach attitude to an attitude just short of level flight, so as to touch the runway with a gentle 100 fpm descent. Says who? Well this AC gives us 7 seconds from crossing the threshold to touchdown, so I think my 4 seconds is right.
The touchdown point used in the performance data assessment reflects the assumed air distance. Operational landing data usually includes an allowance for 1,500 feet or 7 seconds of air distance from the threshold to touchdown. An air distance as short as 1,000 feet may be used IF an operator’s landing assessment procedures include enhancements to minimize the risk of overruns or undershoots, including:
- Training in touchdown control and short field landing techniques.
- Identification of required touchdown point and training to assure go-around procedures are initiated if unable to achieve a suitable touchdown point.
- Approach guidance and runway markings on the specific runway are consistent with a shorter air distance.
- Operational data (without the need for interpolation) are provided to the crew for the specific runway, conditions, and aircraft landing configuration.
- The flight techniques assumed in the creation of the performance data used for a shorter air distances are based on flight techniques to be used in the shorter air distance operation.
Source: SAFO 19001, Touchdown Point
Most of us realize that the numbers in our manuals are based on maximum braking as soon as the wheels are down. But do you know the actual touchdown rate? Very few manufacturers publish these numbers, a rare exception is Gulfstream. For example:
Landing distances based on 3.5° glide path at 50 feet and 8 FPS sink rate at touchdown.
Source: Gulfstream G550 Aircraft Operating Manual, §13-03-20, ¶1.A.(3)
To convert 8 FPS into something more tangible, multiply by 60. That means you are touching down at 480 feet per minute (fpm). In a G550 your typical ILS final has a descent rate of 600 fpm. So you are barely flaring at all. I've witnessed one or two "no flare" landings in the GV and it isn't pretty, but it works. So there are two lessons here: (1) Learn to touchdown more firmly, and (2) Don't expect to realize the landing distance numbers in your manual.
A proper flare reduces the aircraft’s rate of descent to achieve the desired firm landing. If the flare is extended while additional speed is bled off, additional runway will be used. An extended flare may also result in an increase in pitch attitude, which may lead to a tail strike. A firm landing does not mean a hard landing, but rather a deliberate or positive touchdown at the desired touchdown point. A landing executed solely for passenger comfort considerations, which extends the touchdown point beyond the touchdown zone (TDZ), is not impressive, desirable, or consistent with safety or regulations. It is essential to fly the airplane onto the runway at the target touchdown point.
Not everyone publishes landing touchdown rates. Some give flare times, make general statements, or don't say anything at all. Here are some examples that do and do not:
Source: AC 91-79A, appendix 1, ¶6.
Boeing Example
The reference landing distance is the distance from threshold to complete stop. It includes an air distance allowance from threshold to touchdown associated with a flare time of 7 seconds.
Source: Boeing 787-BBJ Flight Crew Operations Manual, §PI.17.7
That works out to an average of 429 feet per minute.
Bombardier Example
FULL STOP LANDING — Perform partial flare, and touchdown without holding off.
Source: Bombardier BD-700 Airplane Flight Manual, §04-08-16, ¶12
Cessna Example
Load Factors / Landing . . . +3.5G / This acceleration represents landing at a sink rate, at touchdown, of 600 feet per minute.
Source: Cessna Citation X Model 750 Airplane Flight Manual, p.2-310-5
Gulfstream Example
Landing distances based on 3.5° glide path at 50 feet and 8 FPS sink rate at touchdown.
Source: Gulfstream G550 Aircraft Operating Manual, §13-03-20, ¶1.A.(3)
It almost seems the system is trying to trap you; if you attempt to land where the AFM landing distance equals the runway length, you are indeed. There are two things you can do to help yourself:
- Always give yourself at least the SAFO 06012 Safety Factor of 15%
- Learn how to flare your airplane to keep it in the touchdown zone, and do this consistently.
12
Pilot procedures: after touchdown and reverse thrust
After touchdown
Once you touchdown the aerodynamic drag of the aircraft starts the process of slowing the airplane. But you will also have help from thrust reversers (or reverse pitch on the props), ground spoilers (or speed brakes), and the wheel brakes. I've drawn this graph to show a generalized idea of what is effective and when. This comes from a Challenger 605 but the idea works for all aircraft with a few caveats. Bottom line: the thrust reversers are most effective early on and the effectiveness of the wheel brakes depends greatly on the runway condition.
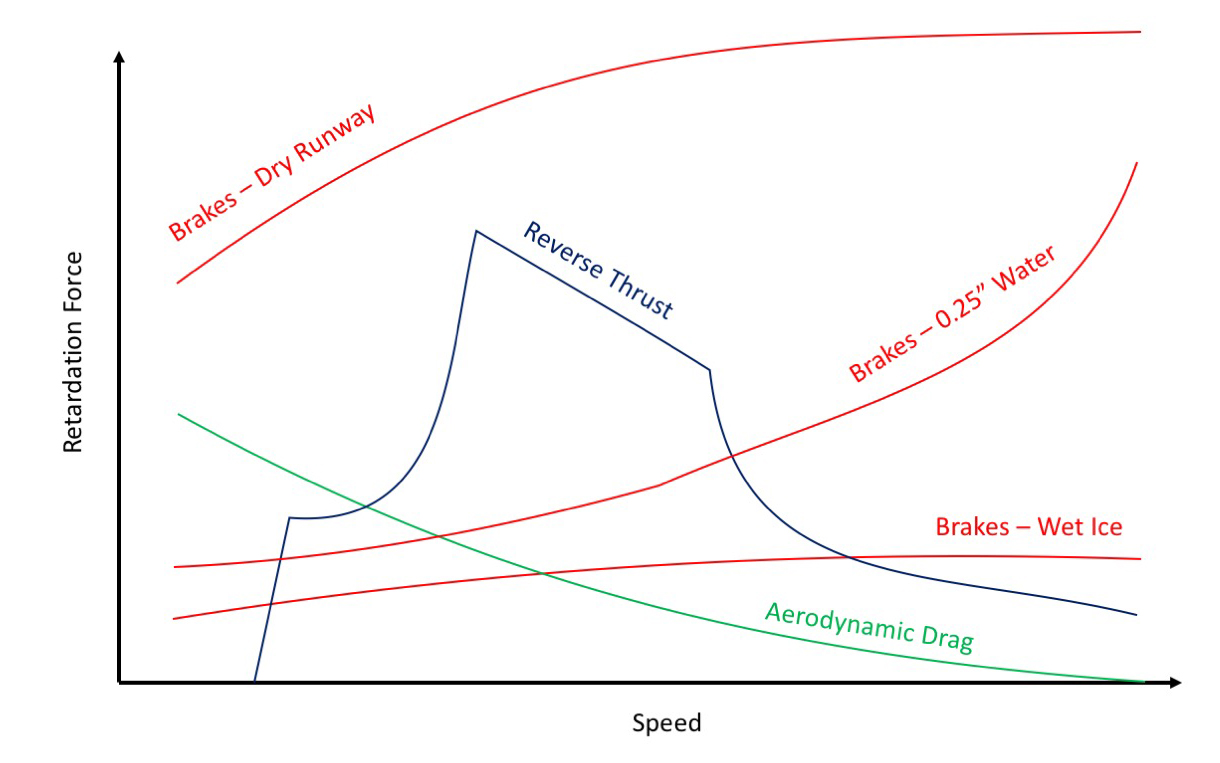
Retardation forces on landing
Note that for our example aircraft, the retardation force of the thrust reversers has to wait for them to unlock and spool up. But once that happens, the force goes way up very quickly. The force decreases as the aircraft decelerates and then there comes a time when they must be brought to idle and the retardation force drops off considerably. For this particular aircraft, the thrust reversers are more effective than the wheel brakes at high speeds on wet runways and ice. This isn't true of all aircraft.
Reverse thrust
We used to always assume reverse thrust was extra; the numbers in our books assumed we didn't have any reverse thrust at all. All that has changed. Some airplanes always assume you have it (such as the BC-700 example shown here). Other assume you have reverse for takeoff but not for landing (such as the G450 example shown here). Of course there are still many aircraft where no thrust reverser credit is ever taken (such as the CL-605 example shown).
A GIV with reversers out at Teterboro
Thrust Reversers. In the event of an asymmetric deployment, the nosewheel on the ground will aid in directional control. If the thrust reversers deploy asymmetrically, or if the airplane begins to drift due to a crosswind, close the thrust reversers and reestablish directional control. Once the airplane’s track down the runway is reestablished, redeploy the thrust reversers. Use airplane steering in accordance with the AFM procedures.
Source: AC 91-79A, appendix 1, ¶5.j.
Bombardier Example
The take-off field length data on wet runways are based on both thrust reversers operable and assumes that maximum available reverse thrust is used down to a complete stop.
Source: Bombardier BD-700 Airplane Flight Manual, §06-01-1, ¶1.A.(7)
ACTUAL LANDING DISTANCE ON CONTAMINATED RUNWAYS — The following charts are used to obtain the actual landing distance on contaminated runways, for a slat OUT / flap 30° landing, for a given value of airplane weight, airport pressure altitude, reported wind, landing approach speed (VREF) increment and number of operable thrust reversers.
Source: Bombardier BD-700 Airplane Flight Manual, §06-01-1, ¶1.A.(7)
Challenger Example
No operation should be predicated on the use of thrust reversers.
Source: CL605 AFM, §03-01-1, ¶2.
Gulfstream Example
Field Length Limited Performance. No reverse thrust credit was taken for accelerate-stop distances computed for dry runways; however, the use of reverse thrust is recommended to reduce the braking distance and the kinetic energy absorbed by the brakes. Wet runway accelerate-stop distances are calculated assuming the deployment of one or both thrust reversers.
Source: Gulfstream G450 Airplane Flight Manual, §05-02-10, ¶1
Deploy thrust reversers as required. Note that reverse thrust credit is not shown in the landing distance charts, but the use of reverse thrust will result in distances less than those computed and significantly improve brake wear characteristics.
Source: Gulfstream G450 Airplane Flight Manual, §05-11-20, ¶3.B.(3)
13
Pilot procedures: avoiding hydroplaning
We all know that hydroplaning occurs when the tire no longer has enough contact with the surface so as to maintain a one-to-one movement of rubber against that surface. In other words, the tire slips. And once it starts slipping, you have less stopping power until you stop the slipping. If you really want to understand that, a little physics lesson is in order . . .
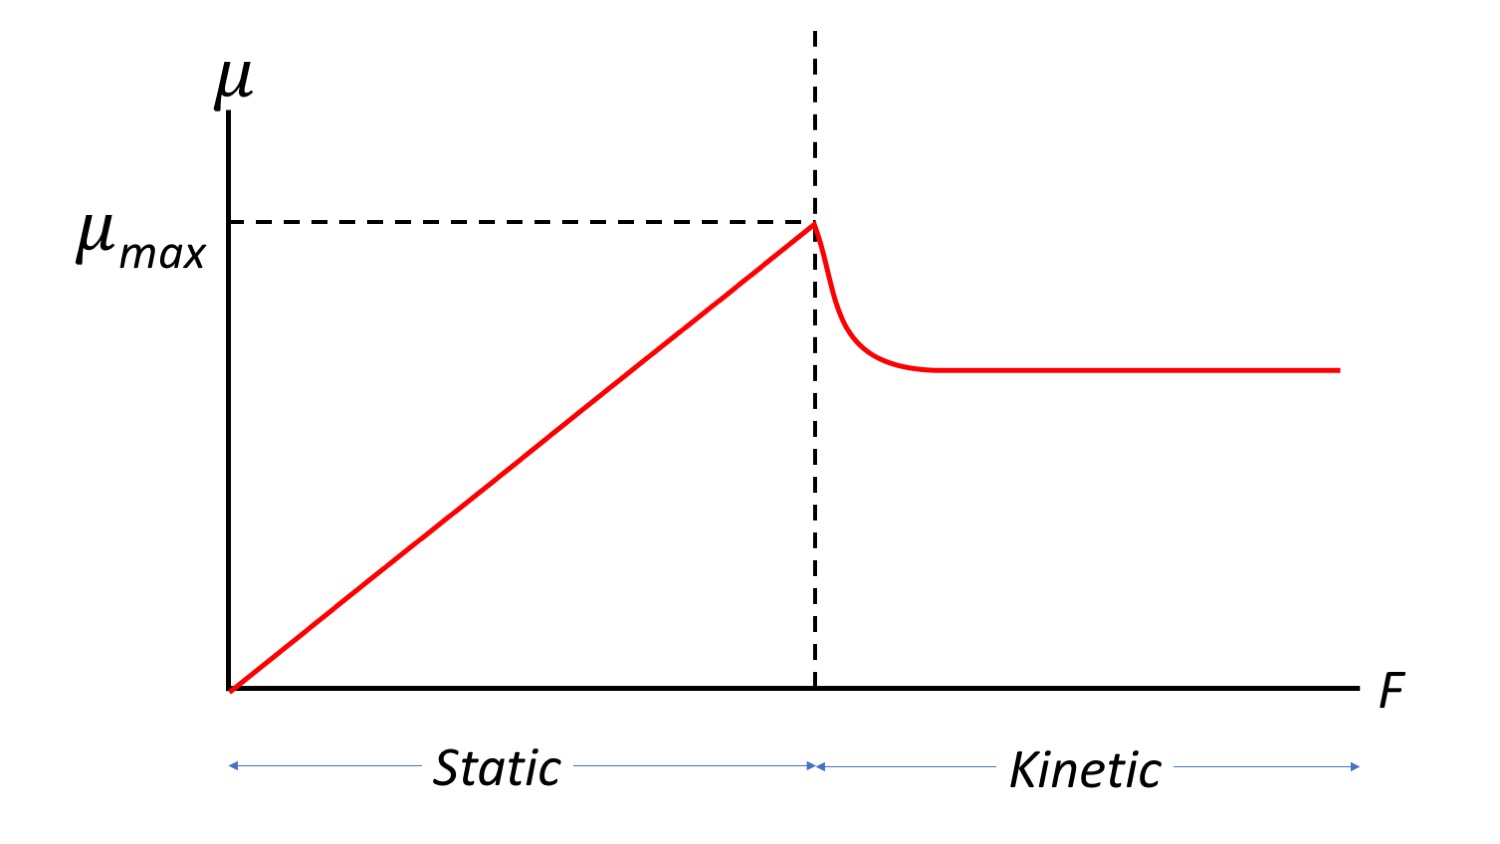
Static versus kinetic friction
We briefly covered Mu (μ) above and learned that it is the coefficient of friction. You can diagram a changing μ against the force applied to the objects where the friction is being measured. The higher the μ the better the friction and your stopping power. You can think of the "F" in the chart above as the amount of friction you are asking from your brakes. The harder you press the higher the "F" you are asking for. Notice that the μ, your stopping force, goes up and up to a point. Once the tire breaks free from the surface you have slippage and the stopping force goes down. The only way to get the stopping force back is to back off on the brakes. That isn't ideal, of course. So the key to success when it comes to stopping on a wet or contaminated runway, is to get your braking up to but short of that point static friction turns to kinetic friction. That's something your anti-skid brake system can do better than you.
Hydroplaning Causal Factors. Hydroplaning is a condition that can exist when an airplane has landed on a runway surface contaminated with standing water, slush, and/or wet snow. Hydroplaning can have serious adverse effects on ground controllability and braking efficiency. The three basic types of hydroplaning are dynamic, reverted rubber, and viscous. Any one of the three can render an airplane partially or totally uncontrollable anytime during the landing roll. Hydroplaning is a significant factor that should be considered in determining stopping or steering capability on a contaminated or otherwise flooded runway. Hydroplaning depends on wheel speed and tire pressure. The key item to remember when the airplane is hydroplaning is that the tires are no longer in contact with the runway, although the airplane is not airborne. Though at high speeds, aerodynamic drag can provide a significant decelerating force. Reverse thrust/propeller reversing, if installed, provides nearly all the decelerating force when hydroplaning since the brakes are essentially ineffective. These characteristics are included in the distances presented in the contaminated runway supplemental data when provided by the airplane manufacturer.
Source: AC 91-79A, appendix 3, ¶11.a.
Dynamic hydroplaning is related to tire inflation pressure. Data obtained during hydroplaning tests have shown the minimum dynamic hydroplaning speed (VP) of a tire to be 8.6 times the square root of the tire pressure in pounds per square inch (psi). For an airplane with a main tire pressure of 24 pounds, the calculated hydroplaning speed would be approximately 42 knots (kts). It is important to note that the calculated speed referred to above is for the start of dynamic hydroplaning. Once hydroplaning has started, it may persist to a significantly slower speed depending on the type being experienced.
Source: AC 91-79A, appendix 3, ¶11.a.(1)
- Hydroplaning is a function of the water depth, tire pressure and speed. Moreover, the minimum speed at which a non-rotating tire will begin to hydroplane is lower than the speed at which a rotating tire will begin to hydroplane because a build up of water under the non-rotating tire increases the hydroplaning effect. Pilots should therefore be aware of this since it will result in a substantial difference between the take-off and landing roll aircraft performance under the same runway conditions. The minimum speed, in knots, at which hydroplaning will commence can be calculated by multiplying the square root of the tire pressure (PSI) by 7.7 for a non-rotating tire, or by 9 for a rotating tire.
Source: Transport Canada Aeronautical Information Manual, ¶1.6.5
Gently "kissing" the runway with the tire increases the chances it will not be rotating when it finally makes rubber-to-runway contact and therefore increasing the likelihood of hydroplaning.
- This equation gives an approximation of the minimum speed necessary to hydroplane on a smooth, wet surface with tires that are bald or have no tread. For example, the minimum hydroplaning speeds for an aircraft with tires inflated to 49 PSI are calculated as:
Non-rotating tire:7.7 X √49 = 54 kt; or Rotating tire: 9 X √49 = 63 kt
Source: Transport Canada Aeronautical Information Manual, ¶1.6.5
These are good numbers to know for each aircraft you fly. For example, a typical Gulfstream's main gear tire pressures will be around 190 psi. That means you can expect to begin hydroplaning around 125 knots and will not regain friction until 106 knots. The nose gear is typically about 135 psi, which means directional control via the nose wheel can be suspect around 105 knots.
- When hydroplaning occurs, the aircraft's tires are completely separated from the actual runway surface by a thin water film and they will continue to hydroplane until a reduction in speed permits the tires to regain contact with the runway. This speed will be considerably lower than the speed at which hydroplaning commences. Under these conditions, the tire traction drops to almost negligible values, and in some cases, the wheel will stop rotating entirely. The tires will provide no braking capability and will not contribute to the directional control of the aircraft. The resultant increase in stopping distance is impossible to predict accurately, but it has been estimated to increase as much as 700 percent. Further, it is known that a 10-kt crosswind will drift an aircraft off the side of a 200-ft wide runway in approximately 7 sec under hydroplaning conditions.
Source: Transport Canada Aeronautical Information Manual, ¶1.6.5
Pilatus PC-24 Wet Runway Tests, from https://www.flyer.co.ukess-aviation-show-headlines/
14
Pilot procedures: braking
Back in the days when large aircraft didn't have anti-skid braking, or the anti-skid systems were rudimentary, we had to handle our brakes with care. We worried about locking up the wheels, blowing the tires, and then having to rely on the remains of each wheel for stopping power. These days, most aircraft will allow you to mash down on the brakes and let the electrons worry about all that. In fact, your aircraft's certified stopping distance may depend on that. So, what else can you do to maximize braking effectiveness? Put the nose wheel down, deploy devices that "spoil" the lift and increase the weight placed on the brakes. And do all this as soon as you can.
Non-Turbojet Airplanes Braking After Touchdown. Putting maximum weight on the wheels after touchdown is an important factor in obtaining optimum braking performance. During the early part of rollout, some lift continues to be generated by the wing. After touchdown, the nosewheel is lowered to the runway to maintain directional control. During deceleration, the nose may pitch down due to braking, transferring the weight from the main wheels to the nosewheel. This does not aid in braking action, so back pressure is applied to the controls without lifting the nosewheel off the runway. This enables directional control while keeping weight on the main wheels. Careful application of the brakes is initiated after the nosewheel is on the ground and directional control is established. Maximum brake effectiveness is just short of the point where skidding occurs. If the brakes are applied so hard that skidding takes place, braking becomes ineffective.
Source: AC 91-79A, appendix 1, ¶5.c.
Braking. A distinction should be made between the procedures for minimum landing distance and an ordinary landing roll with considerable excess runway available. Minimum landing distance will be obtained by creating a continuous peak deceleration of the airplane; that is, extensive use of the brakes for maximum deceleration. On the other hand, an ordinary landing roll with considerable excess runway may allow extensive use of aerodynamic drag to minimize wear and tear on the tires and brakes. If aerodynamic drag is sufficient to cause deceleration, it can be used in deference to the brakes in the early stages of the landing roll. For instance, the use of aerodynamic drag is applicable only for deceleration to 60 to 70 percent of the touchdown speed. At speeds less than 60 to 70 percent of the touchdown speed, aerodynamic drag is so slight as to be of little use, and braking must be utilized to produce continued deceleration. Since the objective during the landing roll is to decelerate, the powerplant thrust should be the smallest possible positive value (or largest possible negative value in the case of thrust reversers).
(1) There are three primary forces available for deceleration during the rollout process: wheel braking, aerodynamic drag, and reverse thrust/propeller reversing, if available. Spoilers are designed to reduce lift and transfer aircraft weight to the landing gear. Deployment of drag devices is most effective at higher speeds and is not affected by runway surface conditions. In all cases, the pilot must ensure the automatic deployment of the deceleration devices occurs. If not, the pilot must immediately manually deploy the devices to minimize the time lost to achieve as close as possible the assessed landing distance.
(2) Timely deployment of spoilers will increase drag by 50 to 60 percent, but more importantly, deployment of the spoilers increases wheel loading by as much as 200 percent in the landing flap configuration. This increases the tire-to-ground friction force, making the maximum tire braking forces available. Many airplanes with autospoilers installed require weight on wheels to deploy the spoilers, which reinforces the requirement for a positive touchdown, as a soft touchdown can delay the automatic deployment. Spoiler deployment immediately after touchdown provides the greatest benefit.
(3) When minimum landing distances are considered, braking friction forces predominate during the landing roll and, for the majority of airplane configurations, braking friction is the main source of deceleration when the runway is dry.
Source: AC 91-79A, appendix 1, ¶5.d.
Wet and Contaminated Runway Surface. When the runway is wet or slippery, reverse thrust (if the airplane is equipped) may be the dominant deceleration force just after touchdown, and throughout the deceleration if the runway has poor or worse braking conditions. As the airplane slows down, the wheel brakes become the dominant deceleration force. When the runway length is limited, for airplanes equipped with an antiskid system, maximum wheel braking should be applied immediately after touchdown. For airplanes without an antiskid system, slow back pressure should be applied to the yoke such that it will not raise the nose of a nose gear airplane for aerodynamic braking while maximum braking that will not cause skidding is applied. In all situations, braking should be maintained until the airplane slows to a safe taxi speed for the conditions.
Source: AC 91-79A, appendix 1, ¶5.e.
Autobrakes. If the airplane is equipped with autobrakes, manufacturers recommend the use of the autobrakes for all landings on contaminated runways. Autobrakes are applied earlier in the landing roll, and to the level selected by the pilot(s) or flightcrew for the anticipated landing condition, and runway available, and provide the most efficient and timely use of braking action. However, the pilot must ensure that if the autobrakes do not engage upon touchdown, then manual braking must be applied.
Source: AC 91-79A, appendix 1, ¶5.f.
Antiskid. Application of brakes is different for airplanes equipped with a functioning antiskid braking system than for airplanes without such a system.
(1) For airplanes without an antiskid system, brakes should be applied progressively throughout the deceleration process, and the pilot must recognize the point that wheel skid occurs. Maximum braking effectiveness occurs just prior to the point where wheel skidding occurs. However, should a skid occur, releasing brake pressure can stop skidding and then maximum braking can be reestablished until the deceleration process is completed. Pilots should be aware that a skid is most likely at higher speeds and at that point may not be perceptible.
(2) For airplanes with an antiskid system, to achieve the benefits of antiskid, the brakes must be applied firmly throughout the deceleration process. When maximum braking is required, it is accomplished by holding maximum brake application pressure and allowing the antiskid system to operate. Letting up on the brakes (unless required to regain directional control) defeats the purpose of the antiskid system. The pulsation caused by the modulation of the brake pressure by the antiskid system indicates that the antiskid system is operating normally, although the pulsation may be disconcerting to the pilot.
Source: AC 91-79A, appendix 1, ¶5.g.
15
Don't do this: aerobraking
If you have any experience in jet fighter aircraft or something similar (fast, high angle of attack, prefers landing in a crab), you may be tempted to reduced the wear on your brakes and even improve your stopping distance by leaving the nose up in the air a bit longer to "aero brake." The theory in smaller "fighter" type aircraft is they have very small brakes and the aircraft is fully controllable with its nose up in the air to offer the relative wind the most resistance. This is unsafe in a large, transport category aircraft where directional control below VMCA depends on a three-point attitude. Besides, it is unnecessary and counterproductive. Unnecessary because your brakes are more capable. Counterproductive because those brakes work best with as much weight on them as possible. So: unsafe, unnecessary, and counterproductive. So don't do it, okay?
F-16 aerobraking
Aerobraking increases landing distance
Even on aircraft where aerobraking is recommended, it doesn't help with landing distance. For example:
After touchdown, continue to increase back pressure on the stick to obtain the highest possible nose-high attitude without flying the aircraft off the runway. Just prior to loss o elevator authority, lower the nosewheel to the runway. After the nosewheel is lowered to the runway, a single, smooth brake application should be used to stop. This technique could increase landing distance as much as 50 percent from that computed from the landing distance chart in Part 7 of Appendix.
Source: 1-TO-T-38A-1, p. 2-12
Aerobraking reduces controllability
Certification rules don't explicitly cover what it takes to maintain control on the ground, other than during takeoff. Even VMCL is really a speed for flight, just prior to landing . . .
VMCL is the minimum control speed during approach and landing with all engines operating, is the calibrated airspeed at which, when the critical engine is suddenly made inoperative, it is possible to maintain control of the airplane with that engine still inoperative, and maintain straight flight with an angle of bank of not more than 5 degrees. VMCL must be established with—
(1) The airplane in the most critical configuration (or, at the option of the applicant, each configuration) for approach and landing with all engines operating;
(2) The most unfavorable center of gravity;
(3) The airplane trimmed for approach with all engines operating;
(4) The most favorable weight, or, at the option of the applicant, as a function of weight;
(5) For propeller airplanes, the propeller of the inoperative engine in the position it achieves without pilot action, assuming the engine fails while at the power or thrust necessary to maintain a three degree approach path angle; and
(6) Go-around power or thrust setting on the operating engine(s).
Source: 14 CFR 25.149 (f)
So, given the lack of certification rules, I encourage you to check your aircraft's procedures. But lacking those, if you are flying a multi-engine aircraft consider that the size of your vertical fin was designed primarily to help you maintain lateral control in the event of an engine failure. Many of the fighters (and the T-38 example) are licensed as "multi-engine limited to centerline thrust." Chances are your airplane has no such limitation. That means your vertical fin will act as a very large weather vane, turning you into the wind at a rate your rudder might not be able to counteract. Try this in the simulator with a crosswind: after landing keep the nose up for as long as you can and see how much time it takes to hit the grass. You might be surprised.
Aerobraking reduces wheel brake efficiency
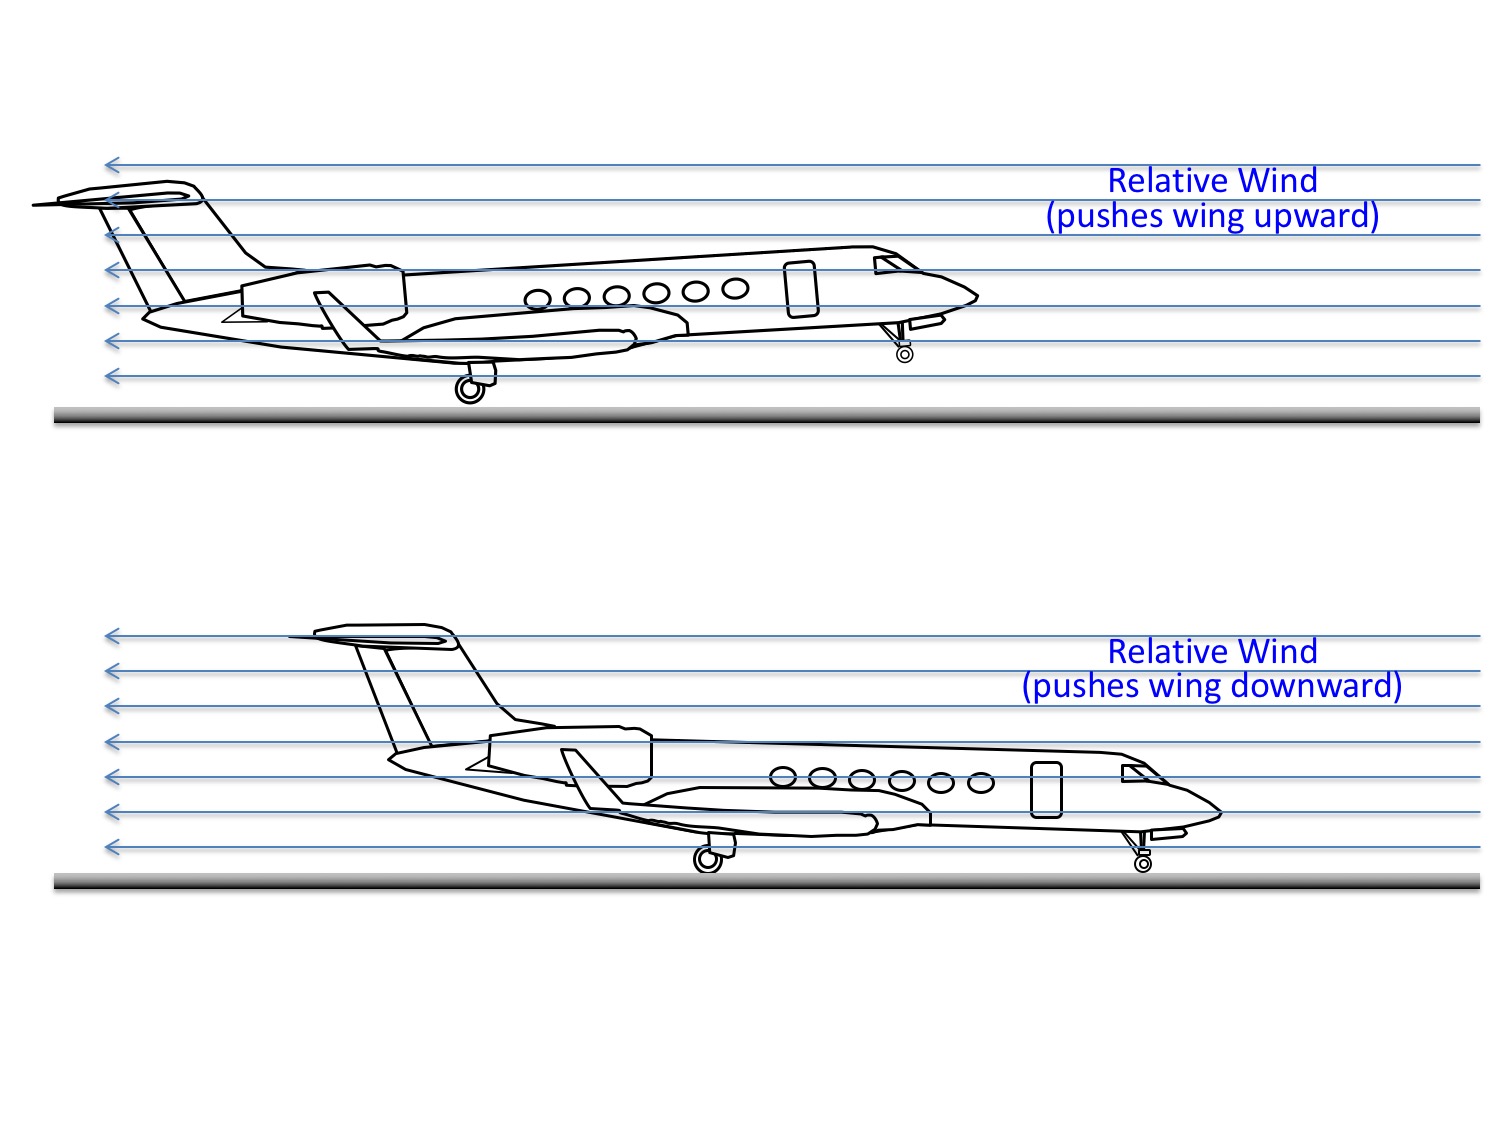
Touchdown relative wind
Most aircraft enter the flare with a nose up pitch and positive angle of attack on the wings. The relative wind hits the wing bottom first, having the effect of pushing the nose of the aircraft upward. As the main gear touch, the momentum of the aircraft continues downward and the aircraft tends to pivot around the main gear, throwing the nose gear downward. We quite naturally add back pressure to cushion the nose wheel's landing. (For many aircraft, it is a landing all it own, distinct from the main gear landing.) From the stand point of braking efficiency, however, all this is good. The relative wind helps add weight to the wheels and thereby improve the efficiency of the brakes. Why is that?
Remember the equation Ff= μ FN? If not, see Mu (μ), above. The key point is that so long as you don't exceed the μ, the more N (downward force, or the weight of the airplane), the more Ff (braking force) you have available to use.
16
Performance data
There are three possibilities when it comes to the performance data in your books when it comes to landing on a runway that is less than dry: (1) The data doesn't exist, (2) The data for a wet runway is nothing more than a 15% additive, or (3) The data is a result of actual tests.
You should know where the data in your manual came from. Only then can you approach everything about this topic with a sound foundation.
The landing distance required by § 25.125 without any factors applied. This landing distance is based on dry runway wheel braking and does not need to include runway slope or air temperature accountability, or approach speed additives. It may be based on aggressive flight test techniques when determining the air distance, and does not take credit for reverse thrust or account for the effect of autobrakes. The Unfactored Certified AFM Landing Distance may be used with the factors from Table 1 below to determine a factored time of arrival landing distance.
Source: SAFO 19001, Unfactored Certificated Airplane Flight Manual (AFM) Landing Distance.
Examples
Cessna Citation CJ2+
The Cessna CJ2+ is a 14 CFR 23 (Normal) category airplane and the data for non-EASA crew is pretty up front about this:
All takeoff and landing performance is based on a paved, dry runway.
Source: Cessna Citation CJ2+ AFM, p. 4-5
But for EASA airplanes there is this:
Takeoff Field Length (Wet) The takeoff field length given for each combination of gross weight, ambient temperature, altitude, wind, and runway gradients is the greatest of the following:
- 115 percent of the two-engine horizontal takeoff distance from start to a height of 35 feet above runway surface.
- Accelerate-stop distance.
- The engine-out accelerate-go distance to 15 feet.
- The Dry Takeoff Field Length.
Source: Cessna Citation CJ2+ AFM, p. S24-13
There is a similar statement for landings on wet runways on page 7-4.
Gulfstream G550
Both dry and wet runway performance is included.
Source: Gulfstream G550 AFM, §5.1, p. 5.1-1
Going through the charts, it appear most of their wet runway performance number is better than a 1.15% adjustment, as is permitted by regulatory agencies when "based on a showing of actual operating landing techniques on wet runways."
RCAM Adopted
Some manufacturers have stepped up to the plate in performance software by adding Runway Condition Codes. The following shots, for example, come from the Gulfstream performance application, PlanePerformance.
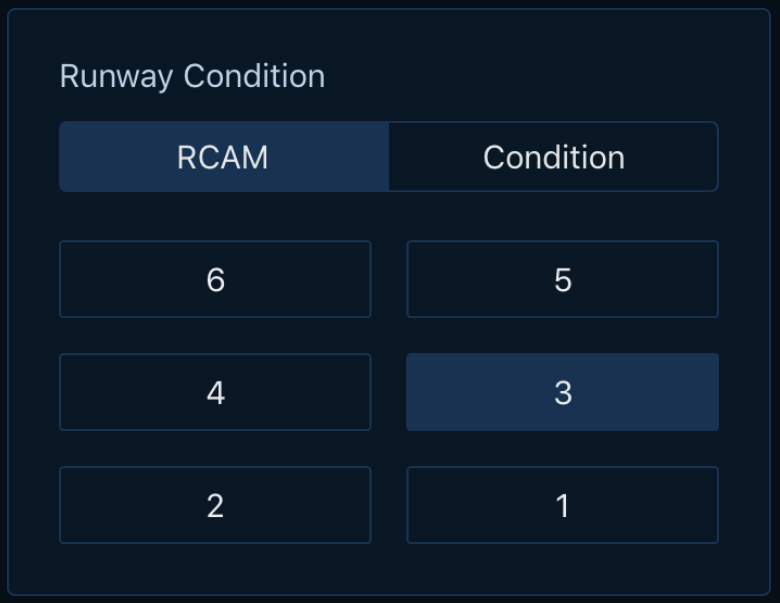
RCAM Entry, PlanePerformance Example
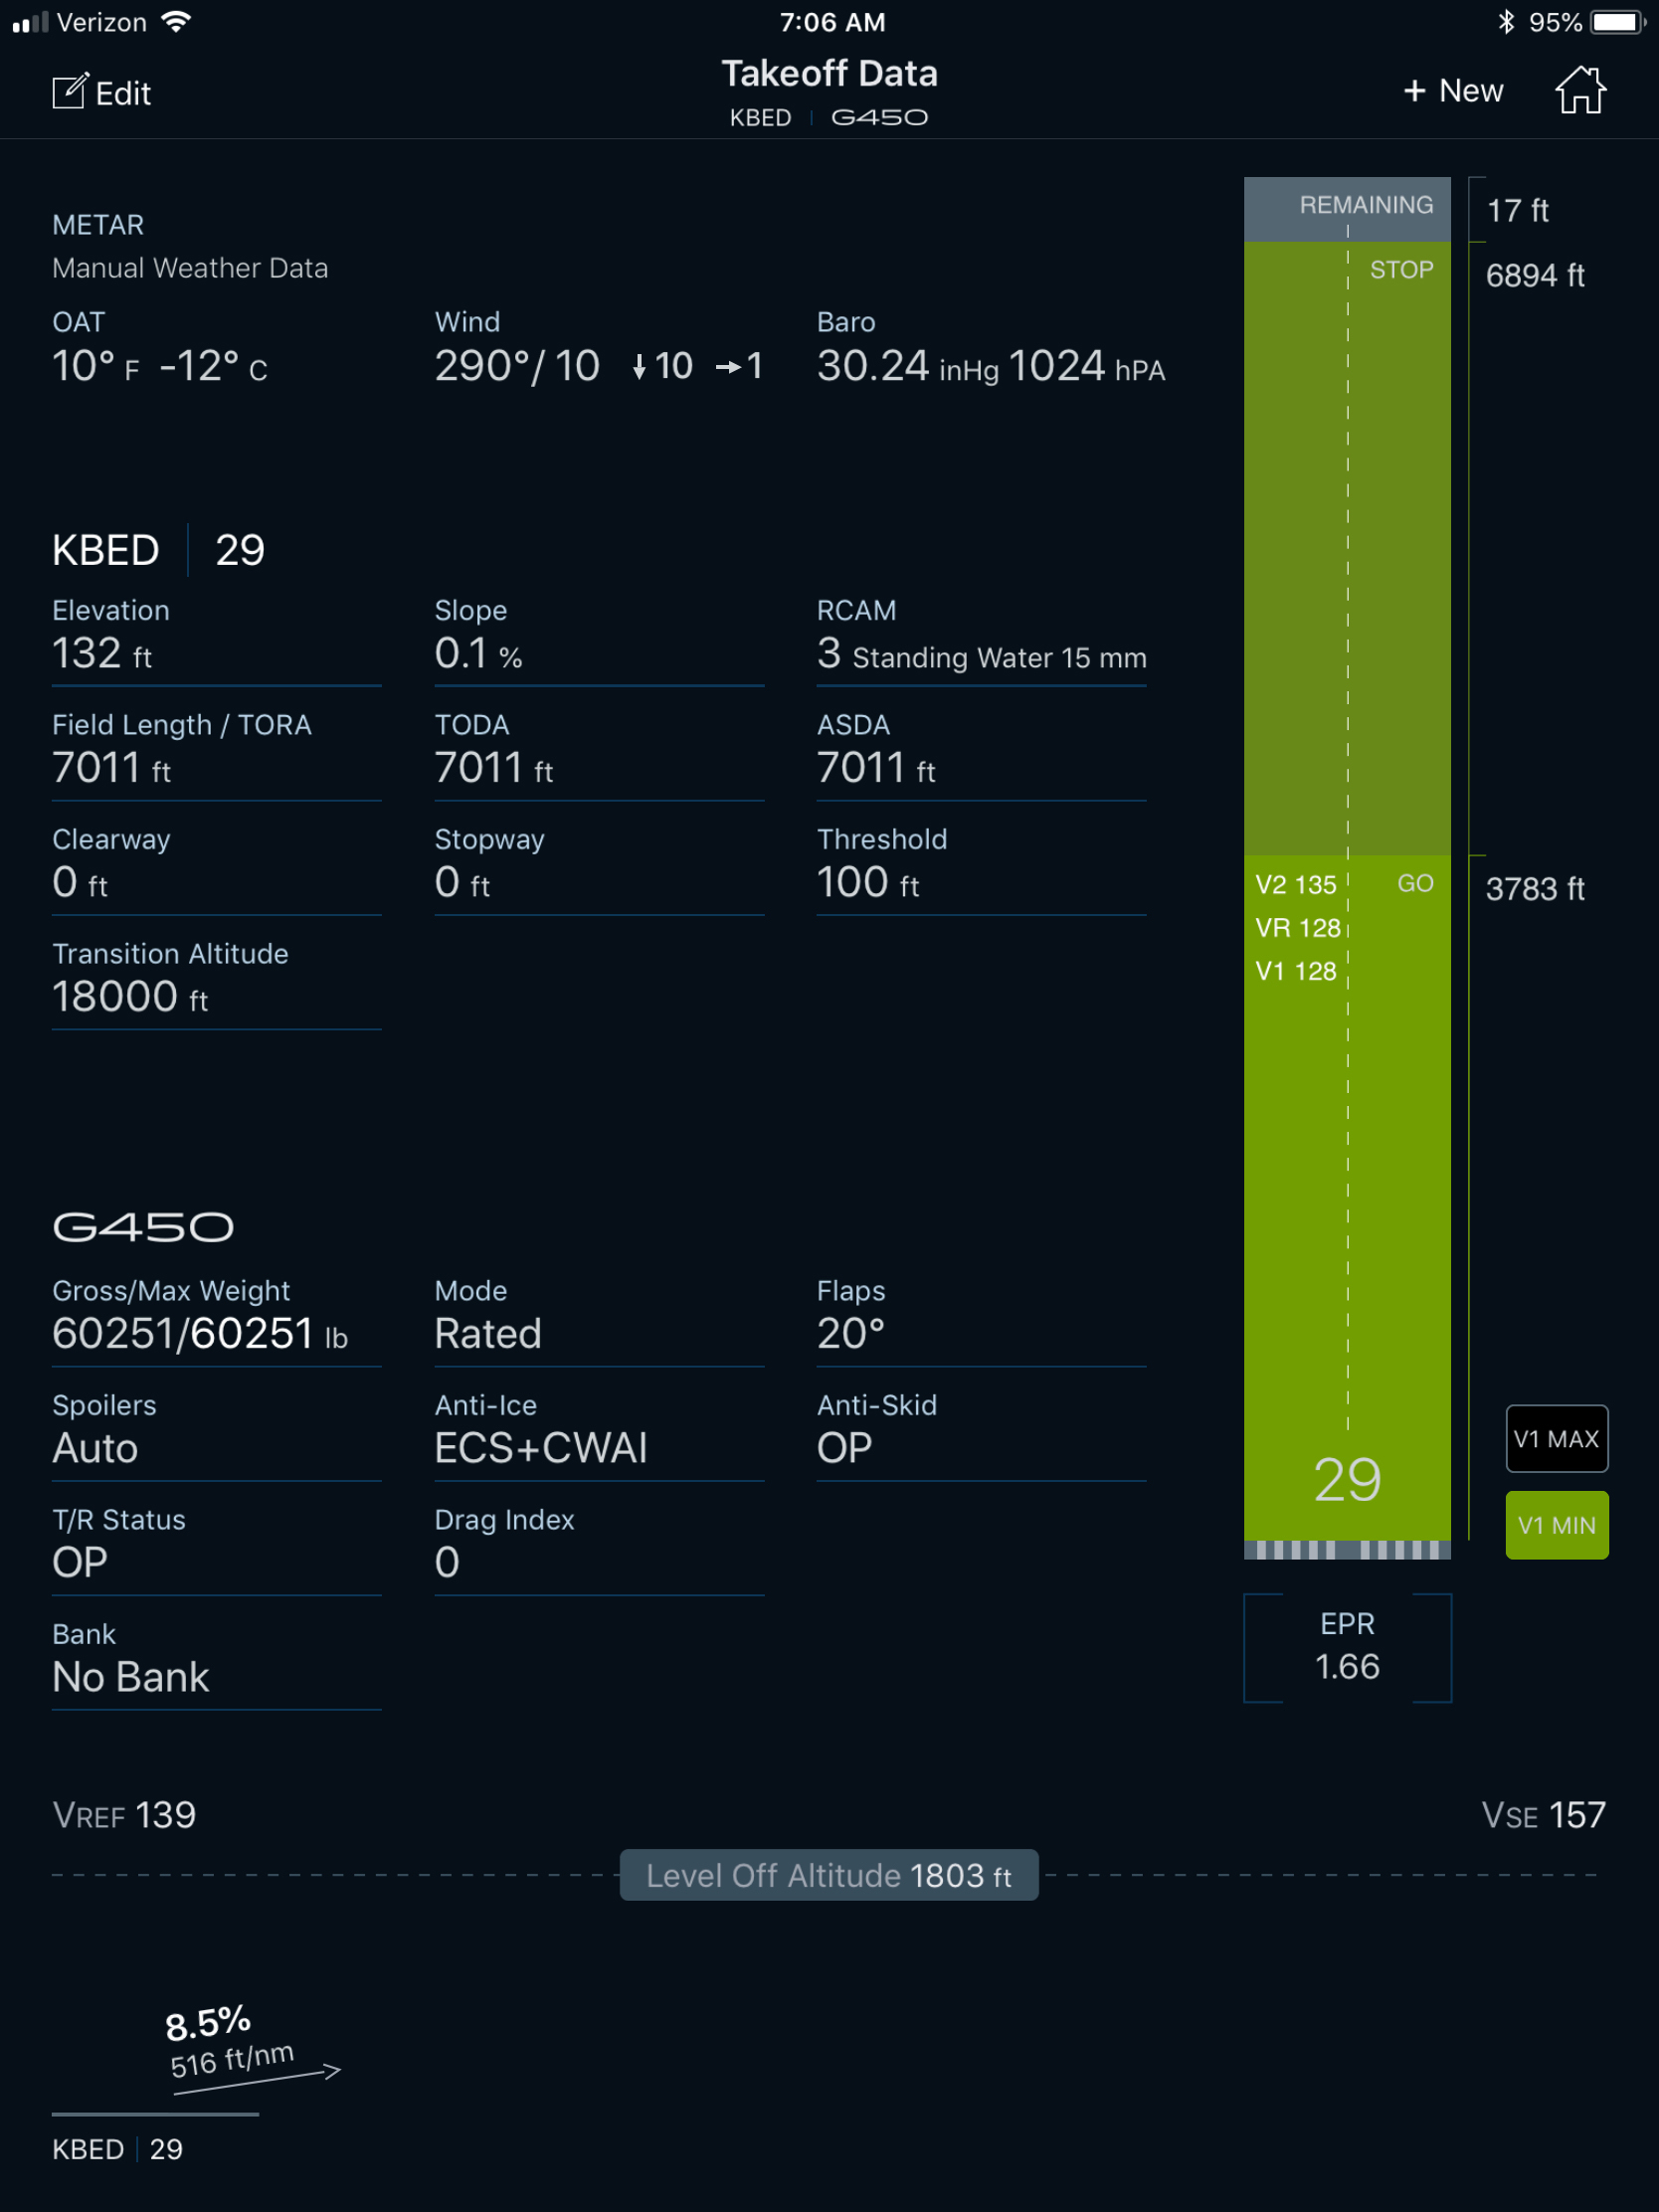
Performance with RCAM showing an RCC of 3, PlanePerformance example
17
Conclusions
Have you ever landed 23 knots fast? Yeah, me too. How about with a tailwind. Yup, same here. How about on a runway that is just barely long enough? I've done that a few times. Now, what about all three of those combined into one landing? I've never done that. I am betting the Citation pilots on N262Y shown here bet they never did either. Just prior to the landing the PIC asked the SIC what he thought. The SIC said, "It's up to you." That turned out to be the wrong answer.
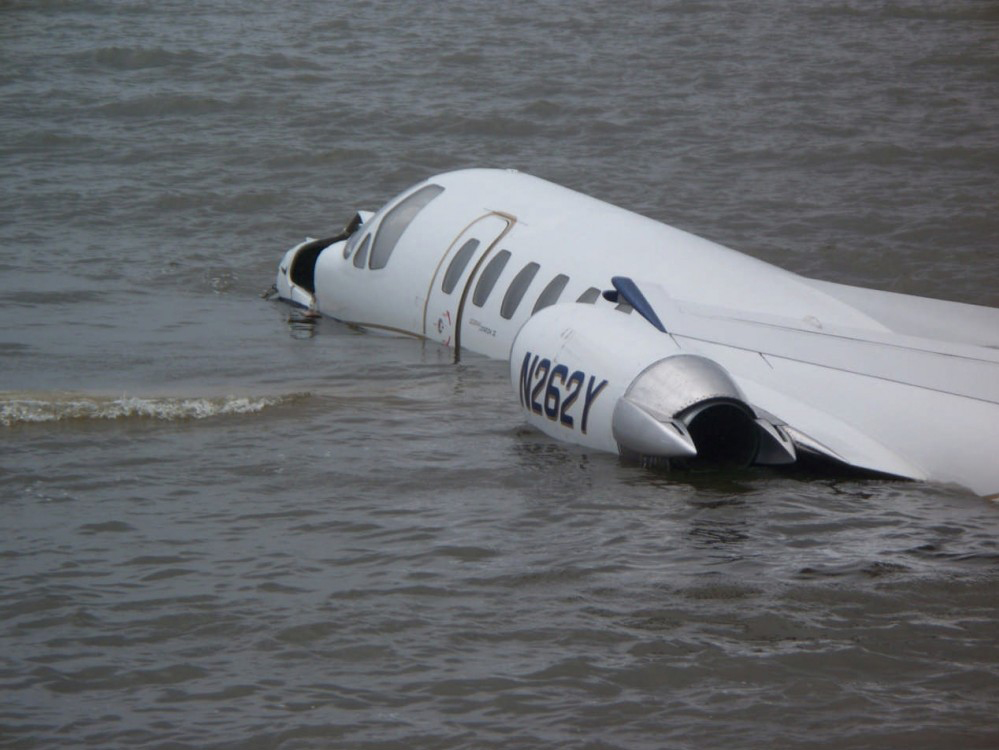
Citation II N262Y, Landing Overshoot KMQI, October 1, 2010
The pilots touched down at an excessive airspeed (23 knots above Vref), more than 1,200 feet down a wet 4,305-foot-long runway, leaving about 3,100 feet for the airplane to stop. According to manufacturer calculations, about 2,710 feet of ground roll would be required after the airplane touched down, assuming a touchdown speed at Vref; a longer ground roll would be required at higher touchdown speeds. Although a 2 knot crosswind component existed at the time of the accident, the airplane's excessive airspeed at touchdown (23 knots above Vref) had a much larger effect on the outcome of the landing.
Source: NTSB ERA11FA001
Landing on anything less than a dry runway ought to set into motion an additional set of precautions in your normally cautious pre-landing decision making. You need to get relevant and recent weather and go through your airplane's performance numbers to make sure it will all work out, on paper at least. On a wet runway, you need to add 15% to the dry runway numbers if your manufacturer doesn't provide wet runway data. If the runway is grooved, you might be able to consider it "effectively dry" if your manufacturer permits this. But once the surface gets much deeper than 0.1 inch or slush is involved, that "effectively dry" runway may not be after all. You will have a number of safety factors to consider prior to departure if you are a commercial operator. Commercial operators will also have to add 15% to landing distance numbers once en route; Part 91 operators should be doing this too. You should also remember that the way you flare the airplane, apply reverse thrust, and brake the airplane have a big impact on your stopping distance. Many pilots get most of this wrong.
One of the problems with the way most of us pilots approach this subject is the way we look at accident reports of pilots who failed to stop on the confines of a runway. "I would never do that." While some of these pilots were careless and had no business in their cockpits, some were quite professional and thought they were doing everything just right. The problem is that we don't have precise tools to measure the runway's condition and our aircraft' braking effectiveness. It behooves us to do everything by the book and, even then, look at everything to do with stopping on a wet or contaminated runway with a skeptical eye.
References
(Source material)
14 CFR 23, Title 14: Aeronautics and Space, Airworthiness Standards: Normal Category Airplanes, Federal Aviation Administration, Department of Transportation
14 CFR 25, Title 14: Aeronautics and Space, Airworthiness Standards: Transport Category Airplanes, Federal Aviation Administration, Department of Transportation
14 CFR 91, Title 14: Aeronautics and Space, General Operating and Flight Rules, Federal Aviation Administration, Department of Transportation
14 CFR 121, Title 14: Aeronautics and Space, Operating Requirements: Domestic, Flag, and Supplemental Operations, Federal Aviation Administration, Department of Transportation
14 CFR 135, Title 14: Aeronautics and Space, Operating Requirements: Commuter and On Demand Operations and Rules Governing Persons on Board Such Aircraft, Federal Aviation Administration, Department of Transportation
Advisory Circular 91-79A, Runway Overrrun Prevention, 2/20/18, U.S. Department of Transportation
Advisory Circular 150/5200-30D, Airport Field Condition Assessments and Winter Operations Safety, 3/8/2017, U.S. Department of Transportation
Aeronautical Information Manual
Boeing 787-BBJ, Flight Crew Operations Manual, September 19, 2016
Bombardier BD-700-1A10 Airplane Flight Manual, Publication No. CSP 700-1A, Revision 80, Jun 03, 2014
Callaghan, John J., Slippery When Wet: The Case for More Conservative Wet Runway Braking Coefficient Models, AIAA Aviation Forum, 13-17 June 2016, Washington, D.C.
Cessna Citation CJ2+ Airplane Flight Manual, Model 525A-300 and On, 30 September 2005
Cessna Citation X Model 750 Airplane Flight Manual, Revision 2, 10 April 2012
EASA Air Ops Annex 1 to VIII, European Aviation Safety Agency, 09 May 2017
FAA Air Traffic Organization Policy, Flight Services, Order JO 7110.10W, March 7, 2013
Gulfstream G450 Airplane Flight Manual, Revision 35, April 18, 2013
Gulfstream G450 Operational Information Supplement, G450-OIS-02, Contaminated Runway Performance, Revision 2, Dec 11, 2017
Gulfstream G550 Aircraft Operating Manual, Revision 27, July 17, 2008
Gulfstream G550 Airplane Flight Manual, Revision 20, 27 March 2007
ICAO Annex 6 - Operation of Aircraft - Part 1 Commercial Aircraft, International Standards and Recommended Practices, Annex 6 to the Convention on International Civil Aviation, Part I, July 2016
ICAO Annex 15 - Aeronautical Information Services, International Standards and Recommended Practices, Annex 15 to the Convention on International Civil Aviation, July 2010
NASA SP-5073, Pavement Grooving and Traction Studies, 1969
NOTAM Manager Training Presentation for Transition to the Runway Condition Assessment Matrix 7930.2R, FAA, Undated
NTSB Aircraft Accident Report, AAR-07/06, Runway Overrun and Collision, Southwest Airlines Flight 1248, Boeing 737-7H4, N471WN, Chicago Midway International Airport, Chicago, Illinois, December 8, 2005
NTSB Aviation Accident Final Report, ERA11FA001, 10/01.2010, Manteo, NC.
Safety Alert for Operators, SAFO 06012, Landing Performance Assessments at Time of Arrival (Turbojets), 8/31/06, U.S. Department of Transportation, CANCELLED BY SAFO 19001
Safety Alert for Operators, SAFO 15009, Turbojet Braking Performance on Wet Runways, 8/11/15, U.S. Department of Transportation, CANCELLED BY SAFO 19003
Safety Alert for Operators, SAFO 16009, Runway Assessment and Condition Reporting, 8/15/16, U.S. Department of Transportation
Safety Alert for Operators, SAFO 19001, Landing Performance Assessments at Time of Arrival (Turbojets), 3/11/19, U.S. Department of Transportation
Safety Alert for Operators, SAFO 19003, Turbojet Braking Performance on Wet Runways, 7/2/19, U.S. Department of Transportation
Technical Order 1T-38A-1, T-38A/B Flight Manual, USAF Series, 1 July 1978
Transport Canada Aeronautical Information Manual
Please note: Gulfstream Aerospace Corporation has no affiliation or connection whatsoever with this website, and Gulfstream does not review, endorse, or approve any of the content included on the site. As a result, Gulfstream is not responsible or liable for your use of any materials or information obtained from this site.