"Any final questions?" the aero professor would ask at the end of each class. "Why is there air?" somebody would invariably ask. "Without air," he would say, "basketballs wouldn't bounce." The class would laugh and we would leave. We did this every single class. I can't explain it. So too it is with most pilots when asked "How do airplane's fly?" They answer "lift." Then comes, "what is lift?"
— James Albright

Updated:
2012-09-26
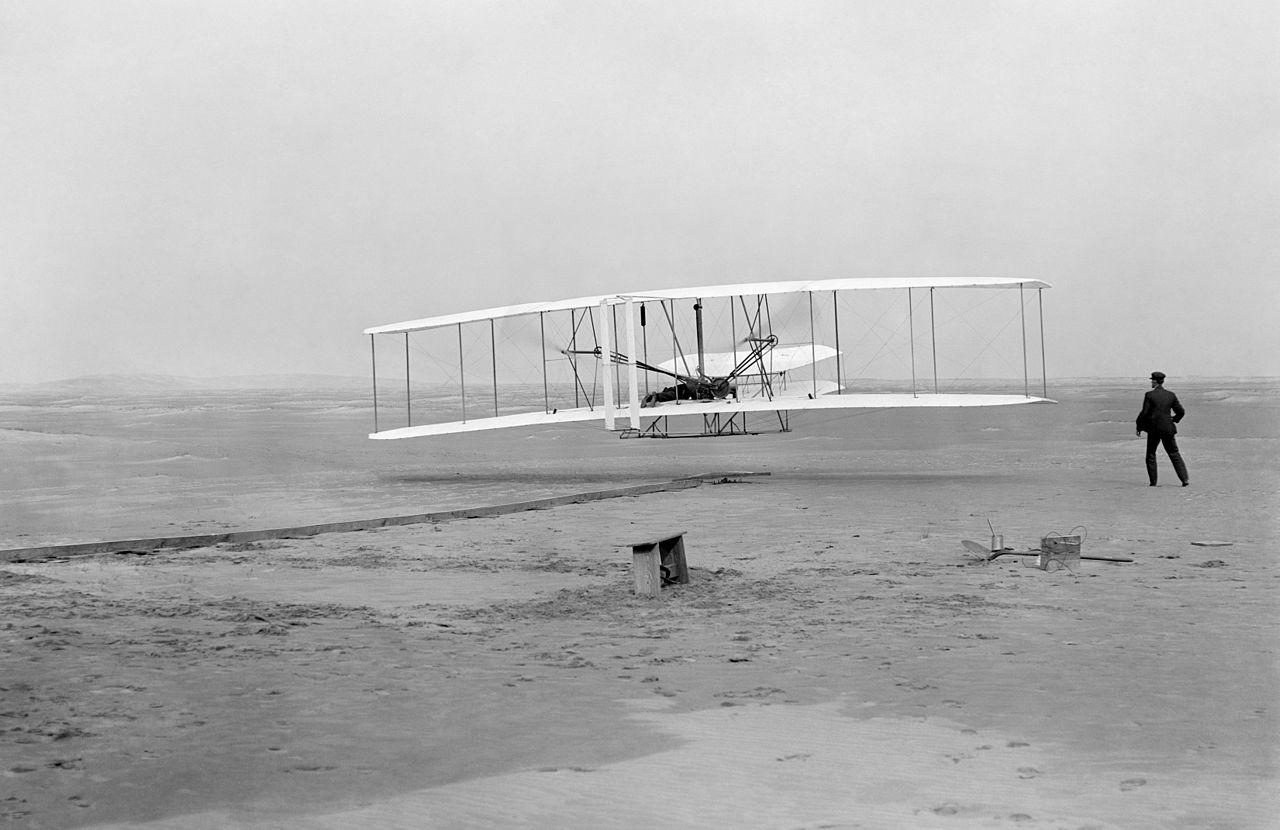
Wright Flyer, first flight
If you want the answer to "What is Lift?" you need to understand the atmosphere and how we, as pilots, measure it.

1
Static pressure
The static pressure of the air P is simply the weight per unit area of the air above the level under consideration. For instance, the weight of a column of air, with a cross sectional area of 1 ft2 and extending upward from sea level through the atmosphere is 2116 lb. The sea level static pressure is, therefore, 2116 psf (or 14.7 psi). Static pressure is reduced as altitude is increased because there is less air weight above. At 18,000 ft altitude the static pressure is about half that at sea level.
Source: Dole, pg. 15
Another commonly used measure of static pressure is inches of mercury. On a standard sea level day the air's static pressure will support a column of mercury (Hg) that is 29.92 in. high. Weather reports use a third method of measuring static pressure called millibars. In addition to these rather confusing systems, there are the metric measurements in use throughout most of the world.
In aerodynamics is is convenient to use pressure ratios, rather than actual pressures. Thus the units of measurement are canceled out.
Pressure Ratio: δ = p / p0
Where P0 is the sea level standard pressure (2116 psf or 29.92 in. Hg).
2
Temperature
The commonly used measures of temperature are the Fahrenheit (F) and Celsius (C) scales. Neither degrees F nor C are based upon absolute zero and cannot be used in calculations. Absolute temperature must be used instead. Absolute zero in the Fahrenheit system is -460 and in the Celsius system is -273°.
Source: Dole, pg. 16
The symbol for absolute temperature is T, and the symbol for sea level standard temperature is T0. Using temperature ratios rather than actual temperatures cancels out the units and simplifies things. The symbol for temperature ratio is θ (theta).
Temperature Ratio: θ = T / T0
3
Density
The density of the air is the most important property of the air in the study of aerodynamics. It is defined as the mass of the air per unit volume. The symbol for density is ρ (rho).
Standard sea level density ρ0 = 0.002377 slugs/ft3. Density decreases with altitude. At about 22,000 ft. the density is about one-half of ρ0. It is desirable in aerodynamics to use density ratios, rather than the actual values of density. The symbol for density ratio is σ (sigma).
Density Ratio: σ = ρ / ρ0
Density is directly proportional to pressure and inversely proportional to absolute temperature, as shown by the universal gas law:
σ = P / RT
and so
where R is the gas constant. Therefore:
Density: σ = δ / θ
Source: Dole, pg. 16
4
Viscosity
Viscosity can be simply defined as the internal friction of a fluid caused by molecular attraction which makes it resist a tendency to flow. The viscosity of air is important when discussing airflow in the region very close to the surface of the aircraft. This region is called the boundary layer. The viscosity of gases is unlike that of liquids, in that with gases an increase in temperature causes an increase in viscosity. The coefficient of absolute viscosity has been assigned the symbol μ (mu). Since aerodynamics often involves considerations f both viscosity and density, ma more usual form of viscosity measurement, known as kinematic viscosity, is often used. It is denoted by the symbol ν (nu).
Kinematic Viscosity: ν = μ / ρ
Source: Dole, pg. 17
5
International Standard Atmosphere (ISA)
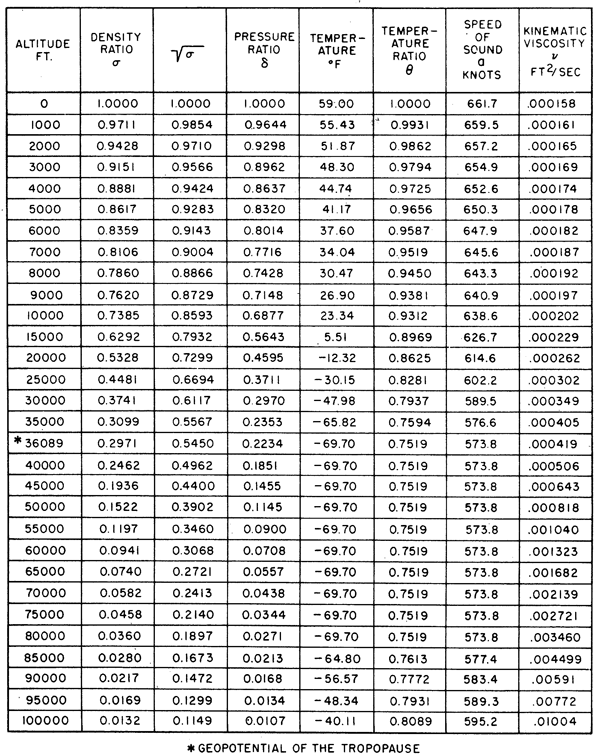
Standard Altitude Table, from Hurt, pg. 5]
As pilots we never deal directly with σ, ρ, θ, or just about any of the other Greek symbols. But we deal with the air mass and much of what we do is constrained by what has become known as the "International Standard Atmosphere."
Scientists, engineers, and people who write aviation textbooks can't seem to agree on what exactly constitutes a standard atmosphere or even where one layer ends and the next begins. Most agree that temperature is key, so that's where we will begin. Since we are international pilots, we'll use the ICAO's definitions.
6
Layers of the atmosphere
ICAO Standard Atmosphere Temperature Model
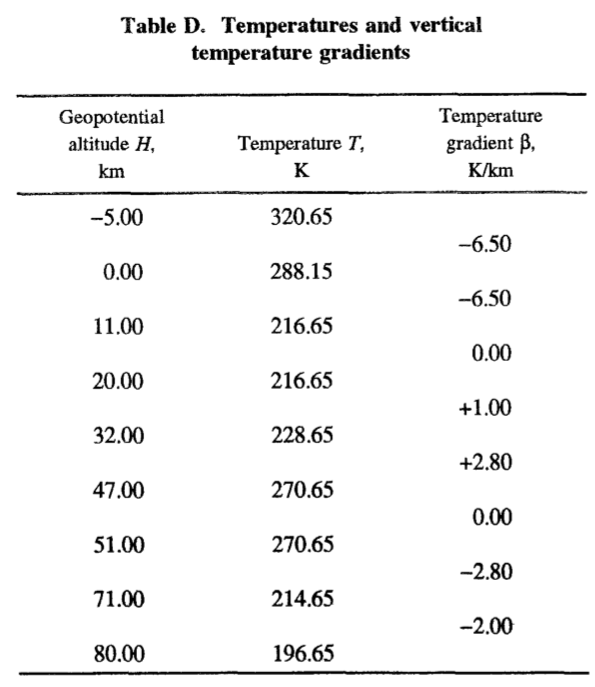
Temperature and Vertical Temperature Gradients Table, from ICAO Doc 7488/3, Table D.
Converting km to feet and °Kelvin to °Celsius, we come up with an ICAO altitude vs. temperature model we can use:
| Altitude (ft) | Temperature (°C) | Gradient (°C) |
|---|---|---|
| 0 | 15 | |
| -1.98 | ||
| 36,089 | -56.5 | |
| 0 | ||
| 65,617 | -56.5 | |
| +0.3 | ||
| 104,987 |
Note:
- °C = °K - 273.15
- Feet = (km) 3280.8399
From this we surmise the troposphere starts at the surface and ends when the temperature no longer loses 2°C every 1,000 feet of altitude, at about 36,000' where the temperature will be -56.5°C. At that point the temperature remains constant for the remainder of most our flight envelopes. Of course all this is based on that so-called "standard" day.
Pilots should be concerned with the height of the tropopause because it determines where most of the weather is, where fuel economy increases plateau, and where aircraft components may be subject to limiting temperatures. Newer data suggests the tropopause is a bit lower than quoted by the advisory circular, typically around 17 km near the equator, above FL 550. At the poles, the tropopause dips as low as 8 km, around FL 260. For most mid-latitudes, we will be spending our time right at or just above the transition layer, the tropopause.
Tropopause Height and ISA
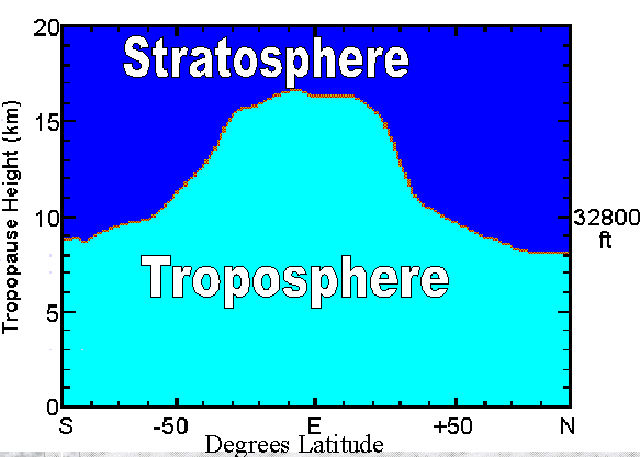
Tropopause Height, from Geerts and Linacre
- The height of the tropopause depends on the location, notably the latitude, as shown in the figure on the right (which shows annual mean conditions). It also depends on the season.
- At latitudes above 60°, the tropopause is less than 9-10 km above sea level; the lowest is less than 8 km high, above Antarctica and above Siberia and northern Canada in winter. The highest average tropopause is over the oceanic warm pool of the western equatorial Pacific, about 17.5 km high, and over Southeast Asia, during the summer monsoon, the tropopause occasionally peaks above 18 km. In other words, cold conditions lead to a lower tropopause, obviously because of less convection.
- Deep convection (thunderstorms) in the Intertropical Convergence Zone, or over mid-latitude continents in summer, continuously push the tropopause upwards and as such deepen the troposphere.
- On the other hand, colder regions have a lower tropopause, obviously because convective overturning is limited there, due to the negative radiation balance at the surface. In fact, convection is very rare in polar regions; most of the tropospheric mixing at middle and high latitudes is forced by frontal systems in which uplift is forced rather than spontaneous (convective). This explains the paradox that tropopause temperatures are lowest where the surface temperatures are highest.
Source: Geerts and Linacre
The tropopause is actually quite lower than the ICAO model predicts, especially at the poles. G450 pilots, for example, spend most of their cruise flight in the tropopause. From a stick and rudder perspective, once the temperature stops decreasing you are not necessarily improving fuel mileage with altitude. (Winds and other weather concerns should determine altitude selection once the lapse rate nears zero.)
7
Altitude measurement
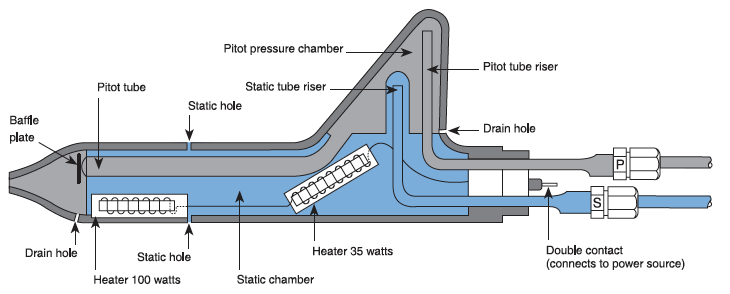
Flight instruments depend upon accurate sampling of the ambient atmospheric pressure to determine the height and speed of movement of the aircraft through the air, both horizontally and vertically. This pressure is sampled at two or more locations outside the aircraft by the pitot-static system. The pressure of the static, or still air, is measured at a flush port where the air is not disturbed. On some aircraft, this air is sampled by static ports on the side of the electrically heated pitot-static head, such as the one in [the figure shown]. Other aircraft pick up the static pressure through flush ports on the side of the fuselage or the vertical fin. These ports are in locations proven by flight tests to be in undisturbed air, and they are normally paired, one on either side of the aircraft. This dual location prevents lateral movement of the aircraft from giving erroneous static pressure indications. The areas around the static ports may be heated with electric heater elements to prevent ice forming over the port and blocking the entry of the static air.
Source: FAA-H-8083-15, pg. 3-1
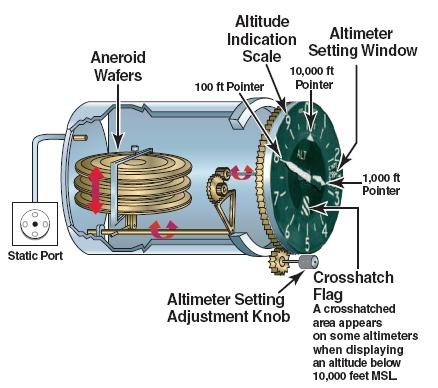
A sensitive altimeter is an aneroid barometer that measures the absolute pressure of the ambient air and displays it in terms of feet or meters above a selected pressure level. The sensitive element in a sensitive altimeter is a stack of evacuated, corrugated bronze aneroid capsules like those shown in [the figure]. The air pressure acting on these aneroids tries to compress them against their natural springiness, which tries to expand them. The result is that their thickness changes as the air pressure changes. Stacking several aneroids increases the dimension change as the pressure varies over the usable range of the instrument.
Source: FAA-H-8083-15, pg. 3-3
8
Airspeed measurement
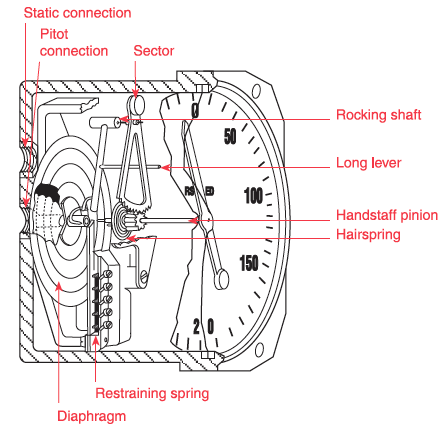
An airspeed indicator is a differential pressure gauge that measures the dynamic pressure of the air through which the aircraft is flying. Dynamic pressure is the difference in the ambient static air pressure and the total, or ram, pressure caused by the motion of the aircraft through the air. These two pressures are taken from the pitot-static system. The mechanism of the airspeed indicator in [the figure] consists of a thin, corrugated phosphor-bronze aneroid, or diaphragm, that receives its pressure from the pitot tube. The instrument case is sealed and connected to the static ports. As the pitot pressure increases, or the static pressure decreases, the diaphragm expands, and this dimensional change is measured by a rocking shaft and a set of gears that drives a pointer across the instrument dial. Most airspeed indicators are calibrated in knots, or nautical miles per hour; some instruments show statute miles per hour, and some instruments show both.
There are many types of airspeed: indicated airspeed (IAS), calibrated airspeed (CAS), equivalent airspeed (EAS), and true airspeed (TAS).
- IAS. Indicated airspeed is shown on the dial of the instrument, uncorrected for instrument or system errors.
- CAS. Calibrated airspeed is the speed the aircraft is moving through the air, which is found by correcting IAS for instrument and position errors. The POH/AFM has a chart or graph to correct IAS for these errors and provide the correct CAS for the various flap and landing gear configurations.
- EAS. Equivalent airspeed is CAS corrected for compression of the air inside the pitot tube. Equivalent airspeed is the same as CAS in standard atmosphere at sea level. As the airspeed and pressure altitude increase, the CAS becomes higher than it should be and a correction for compression must be subtracted from the CAS.
- TAS. True airspeed is CAS corrected for nonstandard pressure and temperature. True airspeed and CAS are the same in standard atmosphere at sea level. But under nonstandard conditions, TAS is found by applying a correction for pressure altitude and temperature to the CAS.
Source: FAA-H-8083-15, pg. 3-7
Indicated Airspeed (IAS)
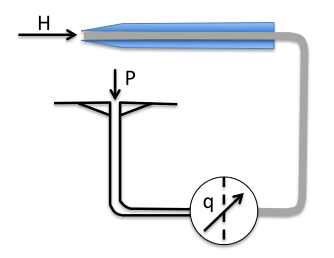
An airspeed indicator is simply a pressure meter which uses static port pressure as a reference. In terms of Bernoulli, the meter reads q which can be found by subtract P from H; because H = P + q.
The airspeed indicator reads this speed which is termed, plainly enough, indicated airspeed.
Calibrated Airspeed (CAS)
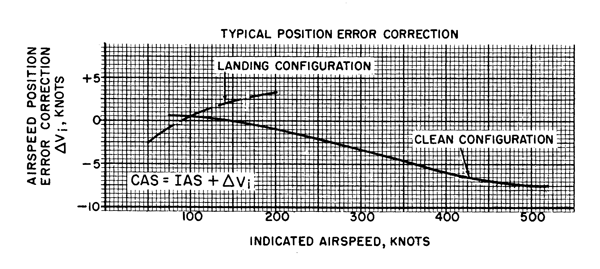
Typical position error correction, from Hurt, pg. 12
The speed indicated by the pitot tube might be in error because of the placement of the pitot tube relative to the relative wind. This is known as position error and when applicable, aircraft manuals will include a correction factor.
Calibrated airspeed is indicated airspeed adjusted for position error. Some aircraft, the G450 for example, make these corrections for the pilot so that the speed indicated on cockpit instruments is actually calibrated airspeed.
Equivalent Airspeed (EAS)
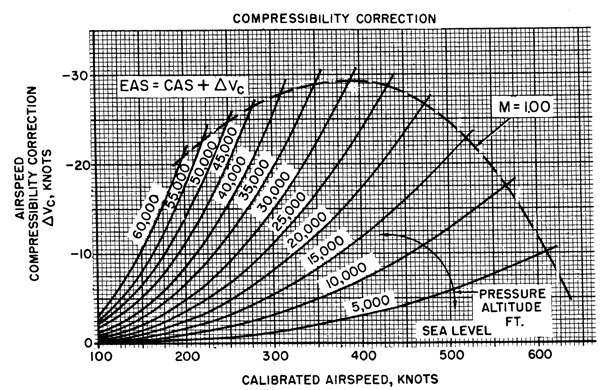
Compressibility correction, from Hurt, pg. 12
Another error occurs when the aircraft travels fast enough to compress the air entering the pitot tube. A compressibility correction chart is used by some aircraft to factor this error..
True Airspeed (TAS)
True airspeed, coupled with ambient density ratio, produces the same dynamic pressure as EAS, coupled with standard sea level density ratio. That is
TAS2 σ = EAS2 σ0
But σ0 = 1, so:
TAS = EAS √ ( 1/ σ)
Source: Dole, pg. 25
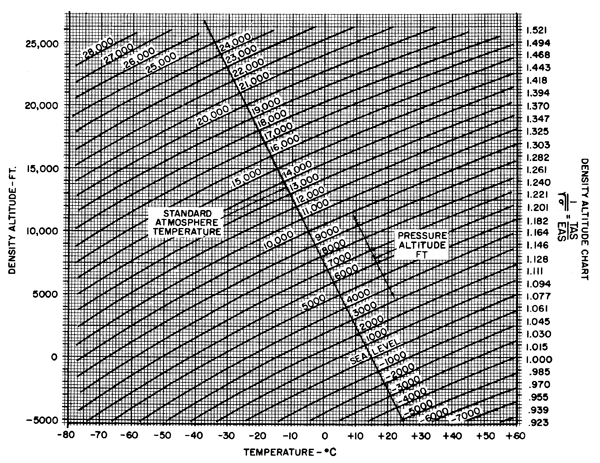
Density altitude correction, from Hurt, pg. 13
Indicated to Calibrated to Equivalent to True Airspeed Conversion
As fledgling Air Force pilots or freshman aeronautical engineering students, the ability to convert from one type of airspeed to another was important. These days computers do it all for us. In the G450, for example, the pilot's primary flight instruments show CAS and TAS. In some aircraft, like the early T-37B, all you got was IAS and you couldn't fly outside the local area without TAS for risk of running out of fuel. For more about that, take a look at my Day One with Ice-T.
References
(Source material)
14 CFR 25, Title 14: Aeronautics and Space, Federal Aviation Administration, Department of Transportation
Advisory Circular 61-107B, Aircraft Operations at Altitudes Above 25,000 Feet Mean Sea Level or Mach Numbers Greater than .75, 3/29/13, U.S. Department of Transportation
Air Training Command Manual 51-3, Aerodynamics for Pilots, 15 November 1963
Connolly, Thomas F., Dommasch, Daniel 0., and Sheryby, Sydney S., Airplane Aerodynamics, Pitman Publishing Corporation, New York, NY, 1951.
Davies, D. P., Handling the Big Jets, Civil Aviation Authority, Kingsway, London, 1985.
Dole, Charles E., Flight Theory and Aerodynamics, 1981, John Wiley & Sons, Inc, New York, NY, 1981.
FAA-H-8083-15, Instrument Flying Handbook, U.S. Department of Transportation, Flight Standards Service, 2001.
Gulfstream G450 Aircraft Operating Manual, Revision 35, April 30, 2013.
Hage, Robert E. and Perkins, Courtland D., Airplane Performance Stability and Control, John Wiley & Sons, Inc., 1949.
Hurt, H. H., Jr., Aerodynamics for Naval Aviators, Skyhorse Publishing, Inc., New York NY, 2012.
ICAO Doc 7488/3 - Manual of the ICAO Standard Atmosphere, International Civil Aviation Organization, 1993
Technical Order 1T-38A-1, T-38A/B Flight Manual, USAF Series, 1 July 1978.
The Height of the Tropopause, B. Geerts and E. Linacre, University of Wyoming, Atmospheric Science, 11/97.
Please note: Gulfstream Aerospace Corporation has no affiliation or connection whatsoever with this website, and Gulfstream does not review, endorse, or approve any of the content included on the site. As a result, Gulfstream is not responsible or liable for your use of any materials or information obtained from this site.