From day one with a Cessna 152 or a Piper Cherokee, we pilots are aware that we only have a limited amount of time before our powered flight aerospace machines become gliders. Some of the aircraft I've flown are not landable without petroleum products turning the engines and most of the others are less than elegant when trying to do so. Our task, then, is to be able to predict the airplane's range in terms of distance or time.
— James Albright

Updated:
2025-05-03
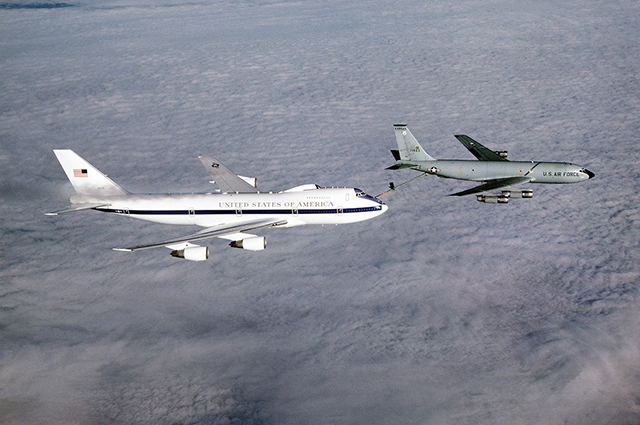
E-4B Air Refueled by KC-135A,
from USAF Photo
A caveat: aerodynamic considerations for propeller driven airplanes are different than for turbojets. There are also variations between turbine and reciprocating engines. Most textbooks consider propeller driven airplanes as one category and turbojets as another. You could argue that a modern turbofan engine is a hybrid. Since most of my formal education on the subject comes from the world of turbojets, though most of my flying has been with turbofans, I will consider them close enough and narrow my aerodynamic discussion to the world of turbojets.
About the photo here, I've flown both aircraft. The KC-135A's cold war mission was to offload every drop of fuel it had to a B-52 bomber. It was a flyable glider but certainly not a good one. I also flew the E-4B, a Boeing 747-200. It carried 303,000 lbs of fuel, burned 25,000 lbs an hour, but could onload every drop of fuel that tanker had to offer. We used to say our endurance was 72 hours, limited only by the capacity of the engine oil reserves. We later found out our limiting factor was the capacity of the lavatories.

1
Endurance versus range
Maximum Endurance
First a word about charts. It is almost impossible to measure thrust in a jet engine unless it is bolted to a stand connected to force gauges, what is known as static thrust. But we know that in unaccelerated flight, thrust = drag so we tend to think of drag = thrust required, so the charts will be labeled "drag or thrust required" and we plot drag. Remeber, in a jet aircraft we have thrust and thrust = drag in unaccelerated flight. What about propeller driven aircraft? We can measure horsepower and we know any given horse power requires a certain fuel flow. So in a propeller driven aircraft you will often see power required on the same axis as fuel flow and we chart power required.
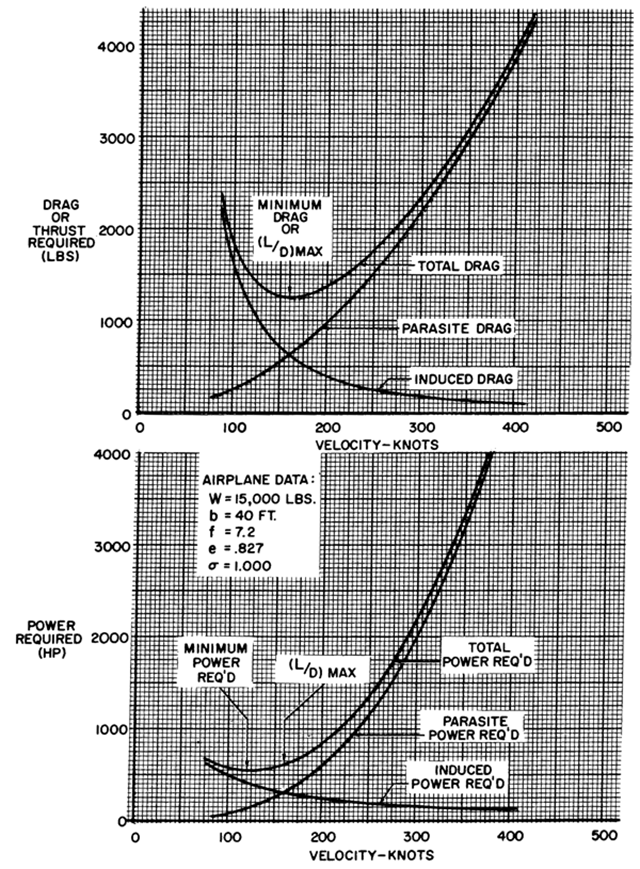
Drag or thrust required versus velocity, propeller-driven aircraft
Dole, figure 3.33
All aircraft must produce thrust to overcome the drag of the aircraft. In turbojets and in other thrust-producing aircraft, this thrust is produced directly from the engine. In aircraft that have propellers (or rotors), the engine does not produce thrust directly. These aircraft are called power producers because the power turns the propeller. The propeller, in turn, develops an aerodynamic force when it is turned through the air; this force is thrust. Fuel consumption of power-producing aircraft is roughly proportional to the power produced, rather than the thrust produced. Range and endurance performance are functions of fuel consumption, and so the power required to fly the aircraft is of prime importance.
Source: Dole, pg. 94
By plotting the power required to maintain steady, unaccelerated flight versus the resulting velocity, you can get a visual representation of what it takes to keep the airplane flying for any given weight, altitude, and configuration. Because the airplane is in a steady flight condition, drag equals the thrust, which is analogous to the power.
Maximum endurance occurs when you have the greatest amount of flying time (T) for the least amount of fuel (F). Said another way, T/F is at a maximum. As can be seen below under Specific Endurance, the reciprocal of the fuel flow is your endurance and you get the best endurance at the low point of the curve.
The point where the ratio of lift-to-drag is at its highest is called L/DMAX. In a propeller-driven aircraft, this point occurs at a speed somewhat faster than the low point of the curve. (More on how to find the point a little later.) For now the key takeaway is this: maximum endurance in a propeller-driven aircraft occurs at a speed below L/DMAX.
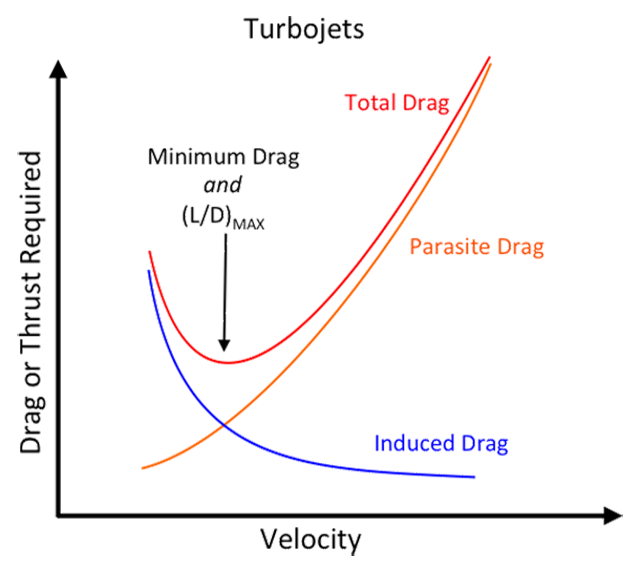
Drag or thrust required versus velocity, turbojet aircraft
Unlike a propeller-driven aircraft, a turbojet produces thrust directly from the engines. The absence of a propeller profoundly changes the way a turbojet flies. The drag or thrust required versus velocity graph looks different as a result. A turbojet typically has the pronounced "u" shape because the induced drag is very high at slow speeds (it takes a high angle of attack) and again at high speeds (the parasite drag becomes restrictive).
The point where the total drag is at a minimum will also be the point where the lift-to-drag ratio will be at a maximum. For a turbojet, this point is known as L/DMAX.
The minimum drag point still represents where the propeller-driven aircraft obtains maximum endurance because it is still the lowest point of the curve. L/DMAX is somewhat faster.
Maximum Range
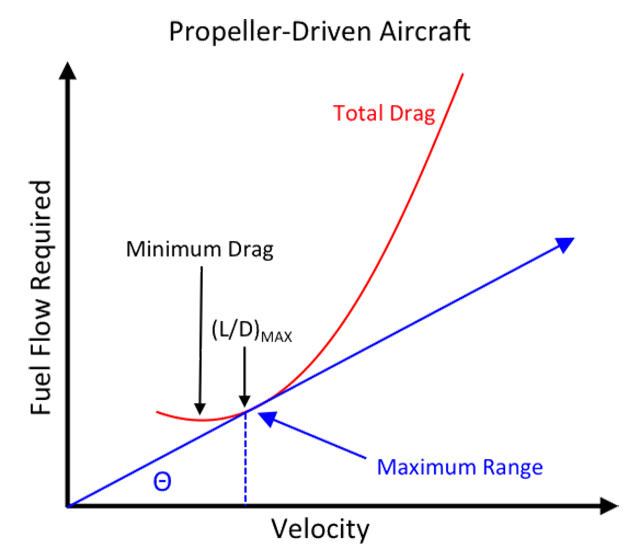
Fuel flow required versus velocity, propeller-driven aircraft
Maximum range occurs when you get the greatest distance (D) for a given amount of fuel (F). The specific range is equal to (D/F), which can also be written (nm/lbs. of fuel). If you divide each side of this equation by 1 hour, you get (nm/hr) / (lbs/hr) and that is the same as (V/FF). Specific range is maximized at (V/FF)MAX, or (FF/V)MIN.
(FF/V)MIN can be found with trigonometry to be the tangent of the fuel flow divided by the velocity:
Graphically, drawing a line from the origin of the chart to a point tangent to the curve will describe a triangle with the FF and V as legs.
This point always describes maximum range. In a propeller-driven aircraft, it also describes L/DMAX.
Some aeronautical textbooks can be misleading on the subject of range versus endurance because the entire aviation world changed with the jet engine. Prior to considering turbojets, many aeronautical texts considered range and endurance to be the same:
Examination . . . reveals that to obtain maximum range, flight must be conducted at maximum L/D.
Source: Airplane Aerodynamics, pg. 279.
In 1951, when this was written, this was almost always true. It remains true for a conventional reciprocating engine with a propeller. With a jet engine, however, flying at L/DMAX gets you maximum endurance. If you want maximum range, you will need to fly faster. that's why were are here . . .
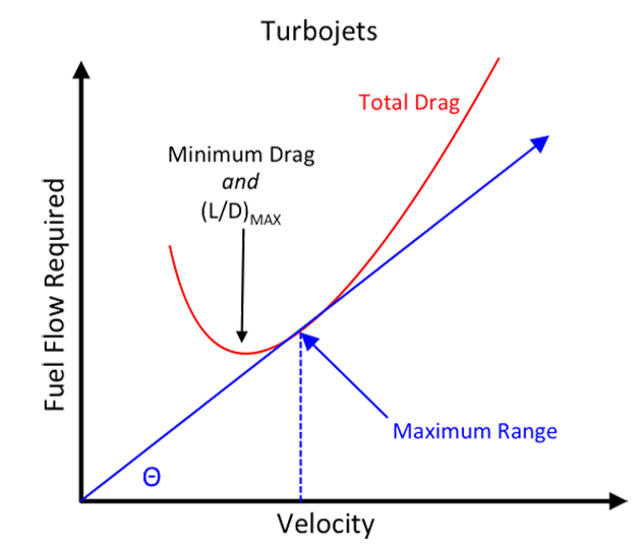
Fuel flow required versus velocity, turbojet aircraft
In a turbojet, maximum range also occurs at the tangent point described for propeller-driven aircraft, but this point will not be at L/DMAX, it will be at a higher speed.
Specific Range
The problem of efficient range operation of an airplane appears of two general forms in flying operations: (1) to extract the maximum flying distance from a given fuel load or (2) to fly a specified distance with minimum expenditure of fuel. An obvious common denominator for each of these operating problems is the "specific range," nautical miles of flying distance per lb. of fuel.
The specific range can be defined by the following relationship:
or,
thus,
If maximum specific range is desired, the flight condition must provide a maximum of velocity/fuel flow. This particular point would be located by drawing a straight line from the origin tangent to the curve of fuel flow versus velocity.
Source: ATCM 51-3, pg. 158
Specific Endurance
The general item of range must be clearly distinguished from the item of endurance. The item of range involves consideration of flying distance while endurance involves consideration of flying time. Thus, it is appropriate to define a separate term, "specific endurance."
or,
then,
By this definition, the specific endurance is simply the reciprocal of the fuel flow. Thus if maximum endurance is desired, the flight condition must provide a minimum of fuel flow. This point is readily appreciated as the lowest point of the curve of fuel flow versus velocity. Generally, in subsonic performance, the speed at which maximum endurance is obtained is approximately 75 percent of the speed for maximum range.
Source: ATCM 51-3, pg. 158
If you are holding at maximum endurance and are released to your destination, what speed do you fly to use the least amount of fuel? That would be the speed for maximum range. If VME = 0.75 VMR, then the inverse of 0.75 is 1.33. Restated: maximum range is generally a third higher than maximum endurance. (In theory, of course.)
2
Range performance
General
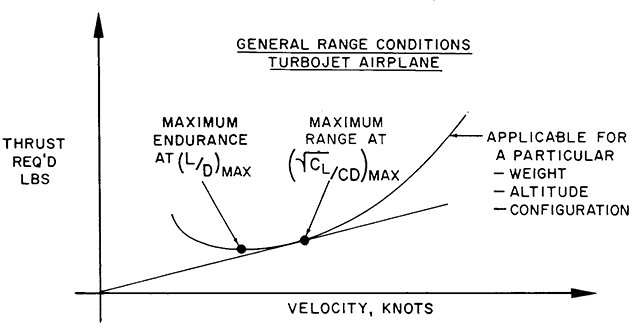
Range performance, general, from ATCM 51-3, figure 2.25.
In the case of a turbojet airplane, the fuel flow is determined mainly by the thrust rather than power.
Source: ATCM 51-3, pg. 164
For a discussion on the differences of what drives us (between turbojet and a propeller driven aircraft), see: Thrust vs. Power.
Thus, the fuel flow could be most directly related to the thrust required to maintain the airplane in steady, level flight. This fact allows study of the turbojet powered airplane by analysis of the curves of thrust required versus velocity. [The figure] illustrates a typical curve of thrust required versus velocity which would be (somewhat) analogous to the variation of fuel flow versus velocity. Maximum endurance condition would be obtained at (L/D)MAX since this would incur the lowest fuel flow to keep the airplane in steady, level flight. Maximum range condition would occur where the proportion between the velocity and thrust required is greatest and this point is located by drawing a straight line from the origin to the curve.
The maximum range is obtained at the aerodynamic condition which produces a maximum proportion between the square root of the lift coefficient (CL) and the drag coefficient (CD), or (√CL/CD)MAX. In subsonic performance, (√CL/CD)MAX occurs at a particular value angle of attack and lift coefficient and is unaffected by weight or altitude (within compressibility limits).
Source: ATCM 51-3, pg. 164
The AOA is unaffected by weight or altitude; the velocity is greatly affected.
At this specific aerodynamic condition, induced drag is approximately 25 percent of total drag so the turbojet airplane designed for long range does not have the strong preference for high aspect ratio planform like the propeller airplane. On the other hand, since approximately 75 percent of total drag is parasite drag, the turbojet airplane designed specifically for long rage has the special requirement for great aerodynamic cleanness.
Source: ATCM 51-3, pg. 164
Effect of Gross Weight
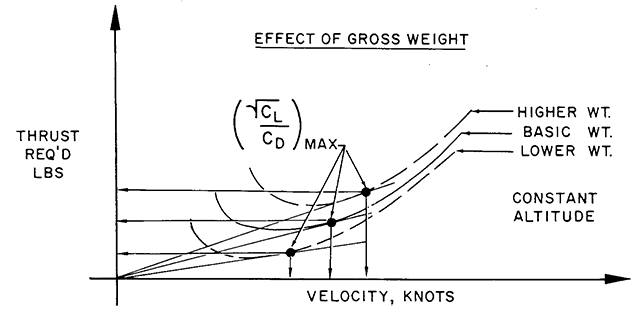
Range performance, weight, from ATCM 51-3, figure 2.25.
The flight condition of (√CL/CD)MAX is achieved at one value of lift coefficient for a given airplane in subsonic flight. Hence, a variation of gross weight will alter the values of airspeed, thrust required, and specific range obtained at (√CL/CD)MAX. If a given configuration is operated at constant altitude and lift coefficient the following relationship will apply:
where
condition (1) applies to some known condition of velocity, thrust required, and specific range for (√CL/CD)MAX at some basic weight, W1
condition (2) applies to some new values of velocity, thrust required, and specific range for (√CL/CD)MAX at some basic weight, W2
and
V = velocity, knots
W = gross weight, lbs.
Tr = thrust required, lbs.
SR = specific range, nmi/lb.
Thus, a 10 percent increase in gross weight would create:
a 5 percent increase in velocity
a 10 percent increase in thrust required
a 5 percent decrease in specific range
when flight is maintained at the optimum conditions of (√CL/CD)MAX at some basic weight, W2. Since most jet airplanes have a fuel weight which is a large part of the gross weight, cruise control procedures will be necessary to account for the changes in optimum airspeeds and power settings as fuel is consumed.
Source: ATCM 51-3, pg. 164
All this means to the pilot is this: if you want to maintain maximum range while burning off fuel, your airspeed is going to have to come back. That in turn will decrease your required thrust setting while increasing your specific range. Alternatively, you can consider climbing.
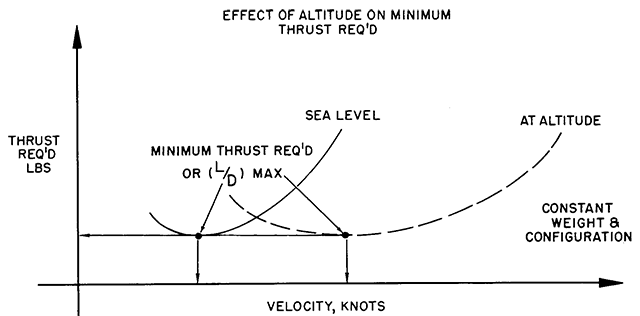
Effect of Altitude
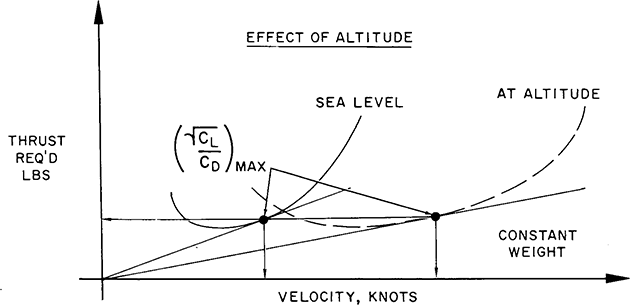
Range performance, altitude, from ATCM 51-3, figure 2.25
The effect of altitude on the range of the turbojet airplane is of great importance because no other single item can cause such large variations of specific range. If a given configuration of airplane is operated at constant gross weight and the lift coefficient for (√CL/CD)MAX a change in altitude will produce the following relationships:
where
condition (1) applies to some known condition of velocity, thrust required, and specific range for (√CL/CD)MAX at some original, basic altitude.
condition (2) applies to some new values of velocity, thrust required, and specific range for (√CL/CD)MAX at some different altitude.
and
V = velocity, knots, TAS
Tr = thrust required, lbs.
SR = specific range, nmi/lb.
σ = altitude density ratio (sigma)
Thus, if flight is conducted at 40,000 ft. (σ = 0.246), the airplane will have:
a 102 percent higher velocity
the same thrust required
a 102 percent higher specific range (even when the beneficial effects of altitude on engine performance are neglected)
than when operating at sea level.
Source: ATCM 51-3, pg. 166
Notice that the entire thrust required curve shifts up and to the right with an increase in altitude. An increase in altitude requires more thrust and velocity.
An increase in altitude will improve powerplant performance in two respects. First, an increase in altitude when below the tropopause will provide lower inlet air temperatures which reduce the specific fuel consumption. Of course, above the tropopause the specific fuel consumption tends to increase. At low altitude, the engine RPM necessary to produce the required thrust is low and, generally, well below the normal rated value. Thus a second benefit of altitude on engine performance is due to the increased RPM required to furnish cruise thrust. An increase in engine speed to the normal rated value will reduce the specific fuel consumption.
The increase in specific range with altitude of the turbojet airplane can be attributed to these three factors:
- An increase in altitude will increase the proportion of (V/Tr) and provide a greater TAS for the same Tr.
- An increase in altitude in the troposphere will produce lower inlet air temperature which reduces the specific fuel consumption.
- An increase in altitude requires increased engine RPM to provide cruise thrust and the specific fuel consumption reduces as normal rated RPM is approached.
From the previous analysis, it is apparent that the cruise altitude of the turbojet should be as high as possible within compressibility or thrust limits. Generally, the optimum altitude to begin cruise is the highest altitude at which the maximum continuous thrust can provide the optimum aerodynamic conditions.
Source: ATCM 51-3, pg. 166
Two points:
- Most jet engines are more efficient at high RPM's, you will get better range operating near the engine's RPM limits.
- Planning on operating at the upper limit of the airplane's cruise capability poses a danger if the outside air temperature rises. You may find the airplane at a higher altitude than it is capable of sustaining.
Effect of Wind
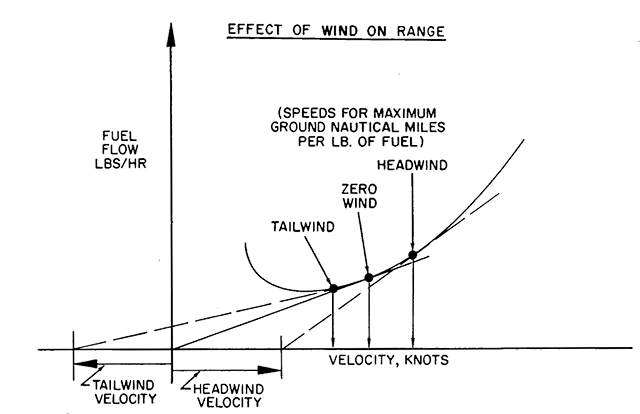
Effect of wind on range, from ATCM 51-3, figure 2.26.
The effect of wind on range is of considerable importance in flying operations. Of course, a headwind will always reduce range and a tailwind will always increase range. The selection of a cruise altitude with the most favorable (or least unfavorable) winds is a relatively simple matter for the case of the propeller powered airplane. Since the range of the propeller powered airplane is relatively unaffected by altitude, the altitude with the most favorable winds is selected for range. However, the range of the turbojet airplane is greatly affected by altitude so selection of an optimum altitude will involve considering the wind profile with the variation of range with altitude. Since the turbojet range increases greatly with altitude, the turbojet can tolerate less favorable (or more unfavorable) winds with increased altitude.
In some cases, large values of wind may cause a significant change in cruise velocity to maintain maximum ground nautical miles per lb. of fuel. As an extreme condition, consider an airplane flying into a headwind which equals the cruise velocity. In this case, any increase in velocity would improve range.
The procedure of employing different cruise velocities to account for the effects of wind is necessary only at extreme values of wind velocity. It is necessary to consider the change in optimum cruise airspeed when the wind velocities exceed 25 percent of the zero wind cruise velocity.
Source: ATCM 51-3, pg. 168
The impact of winds on high speed aircraft tends to be overstated. In fact, at most wind speeds adjusting aircraft speed can be detrimental. I've looked at this for a variety of aircraft. Even for those aircraft where a marginal benefit is seen under some conditions, the benefit disappears for others. My advice, don't bother adjusting without doing the math first. Here is some anecdotal evidence:
CL604
| CL604 | Mach | Wind | TAS | GS | NM/LB | LB/HR | DIST | ETE | LBS | ISA, 33,000', 36,000 lbs |
| Max Range | 0.63 | 0 | 366.6 | 366.6 | 0.232 | 1580.0 | 500 | 1+22 | 2155 | |
| Max Range | 0.63 | 100 | 366.6 | 266.6 | 0.232 | 1580.0 | 500 | 1+53 | 2964 | |
| Faster | 0.66 | 100 | 384.0 | 284.0 | 0.232 | 1655.3 | 500 | 1+46 | 2914 | Speeding up in headwind helps, marginally |
| CL604 | Mach | Wind | TAS | GS | NM/LB | LB/HR | DIST | ETE | LBS | ISA, 33,000', 36,000 lbs |
| Max Range | 0.63 | 0 | 366.6 | 366.6 | 0.232 | 1580.0 | 500 | 1+22 | 2155 | Slower | 0.6 | -100 | 349.1 | 449.1 | 0.23 | 1517.9 | 500 | 1+07 | 1690 | Slowing down in tailwind helps, marginally |
DA2000
| DA2000 | Mach | Wind | TAS | GS | NM/LB | LB/HR | DIST | ETE | LBS | ISA, 35,000', 36,000 lbs |
| Mid Range | 0.8 | 0 | 455.0 | 455.0 | 0.2304 | 1974.8 | 500 | 1+06 | 2170 | |
| Mid Range | 0.8 | 100 | 455.0 | 355.0 | 0.2304 | 1974.8 | 500 | 1+25 | 2781 | |
| Faster | 0.84 | 100 | 476.0 | 376.0 | 0.2042 | 2331.0 | 500 | 1+20 | 3100 | Speeding up in headwind does not help |
| DA2000 | Mach | Wind | TAS | GS | NM/LB | LB/HR | DIST | ETE | LBS | ISA, 35,000', 36,000 lbs |
| Mid Range | 0.8 | 0 | 455.0 | 455.0 | 0.2304 | 1974.8 | 500 | 1+06 | 2170 | |
| Mid Range | 0.8 | -100 | 455.0 | 555.0 | 0.2304 | 1974.8 | 500 | 0+54 | 1779 | |
| Slower | 0.77 | -100 | 439.0 | 539.0 | 0.2361 | 1859.4 | 500 | 0+56 | 1725 | Slowing down in tailwind helps, marginally |
G450
| G450 | Mach | Wind | TAS | GS | NM/LB | LB/HR | DIST | ETE | LBS | ISA, 41,000', 62,000 lbs |
| Max Range | 0.746 | 0 | 427.9 | 427.9 | 0.1679 | 2548.6 | 500 | 1+10 | 2978 | |
| Max Range | 0.746 | 100 | 427.9 | 327.9 | 0.1679 | 2548.6 | 500 | 1+31 | 3886 | |
| Faster | 0.778 | 100 | 446.3 | 346.3 | 0.1646 | 2711.2 | 500 | 1+26 | 3915 | Speeding up in headwind does not help |
| G450 | Mach | Wind | TAS | GS | NM/LB | LB/HR | DIST | ETE | LBS | ISA, 41,000', 62,000 lbs |
| Max Range | 0.746 | 0 | 427.9 | 427.9 | 0.1679 | 2548.6 | 500 | 1+10 | 2978 | |
| Max Range | 0.746 | -100 | 427.9 | 527.9 | 0.1679 | 2548.6 | 500 | 0+57 | 2414 | |
| Slower | 0.73 | -100 | 418.7 | 518.7 | 0.1678 | 2495.4 | 500 | 0+58 | 2405 | Slowing down in tailwind helps, marginally |
G550
| G550 | Mach | Wind | TAS | GS | NM/LB | LB/HR | DIST | ETE | LBS | ISA, 43,000', 65,000 lbs |
| Max Range | 0.725 | 0 | 415.9 | 415.9 | 0.19 | 2188.7 | 500 | 1+12 | 2632 | |
| Max Range | 0.725 | 100 | 415.9 | 315.9 | 0.19 | 2188.7 | 500 | 1+35 | 3465 | |
| Faster | 0.765 | 100 | 438.8 | 338.8 | 0.1895 | 2315.6 | 500 | 1+29 | 3417 | Speeding up in headwind helps, marginally |
| G550 | Mach | Wind | TAS | GS | NM/LB | LB/HR | DIST | ETE | LBS | ISA, 43,000', 65,000 lbs |
| Max Range | 0.725 | 0 | 415.9 | 415.9 | 0.19 | 2188.7 | 500 | 1+12 | 2632 | |
| Max Range | 0.725 | -100 | 415.9 | 515.9 | 0.19 | 2188.7 | 500 | 0+58 | 2121 | |
| Slower | 0.705 | -100 | 404.4 | 504.4 | 0.1895 | 2134.0 | 500 | 0+59 | 2115 | Slowing down in tailwind helps, marginally |
G650
| G650 | Mach | Wind | TAS | GS | NM/LB | LB/HR | DIST | ETE | LBS | ISA, 45,000', 70,000 lbs |
| Max Range | 0.82 | 0 | 470.4 | 470.4 | 0.187 | 2515.3 | 500 | 1+04 | 2674 | |
| Max Range | 0.82 | 100 | 470.4 | 370.4 | 0.187 | 2515.3 | 500 | 1+21 | 3396 | |
| Faster | 0.852 | 100 | 488.7 | 388.7 | 0.1865 | 2620.4 | 500 | 1+17 | 3371 | Speeding up in headwind helps marginally |
| G650 | Mach | Wind | TAS | GS | NM/LB | LB/HR | DIST | ETE | LBS | ISA, 45,000', 70,000 lbs |
| Max Range | 0.82 | 0 | 470.4 | 470.4 | 0.187 | 2515.3 | 500 | 1+04 | 2674 | |
| Max Range | 0.82 | -100 | 470.4 | 570.4 | 0.187 | 2515.3 | 500 | 0+53 | 2205 | |
| Slower | 0.774 | -100 | 444.0 | 544.0 | 0.185 | 2399.8 | 500 | 0+55 | 2206 | Slowing down in tailwind does not help |
PC-12
| PC-12 | Mach | Wind | TAS | GS | NM/LB | LB/HR | DIST | ETE | LBS | ISA, 15,000', 8,000 lbs |
| LRC | 0 | 218.0 | 218.0 | 0.61 | 357.4 | 500 | 2+17 | 820 | ||
| Max Range | 50 | 218.0 | 168.0 | 0.61 | 357.4 | 500 | 2+59 | 1064 | ||
| Faster | 50 | 240.0 | 190.0 | 0.57 | 421.1 | 500 | 2+38 | 1108 | Speeding up in headwind does not help |
| PC-12 | Mach | Wind | TAS | GS | NM/LB | LB/HR | DIST | ETE | LBS | ISA, 15,000', 8,000 lbs |
| LRC | 0 | 218.0 | 218.0 | 0.61 | 357.4 | 500 | 2+17 | 820 | ||
| Max Range | -50 | 218.0 | 268.0 | 0.61 | 357.4 | 500 | 1+52 | 667 | ||
| Slower | -50 | 200.0 | 250.0 | 0.62 | 322.6 | 500 | 2+00 | 645 | Slowing down in tailwind helps, marginally |
3
Range economy
Selecting an en route altitude and speed greatly impacts the amount of fuel burned, but there are other costs that may outweigh the price of Jet-A. The major airlines have long recognized this and that’s why some airline flight management computers (FMC) incorporate a Cost Index (CI) as a performance initialization input. Boeing defines CI as the time cost of the airplane divided by the fuel cost. The time cost includes the crew, maintenance programs and just about everything else that is paid for by the hour. If the fuel is more expensive than everything else, it pays to slow down. If the “everything else” is more than the fuel, you may want to speed up. Few business aircraft FMCs have CI entries, but there are commercial options out there, such as the Pilot Performance Advisory System (PPAS) available at http://www.aasi.com.
You can figure a Cost Index of your own, please feel free to download my Range Economy Spread Sheet and customize it for your operation. If your numbers prove me wrong, please let me know. Until then, here are a few formulas:
Speed of Sound
If your normal cruise speed is flown in Mach numbers, your first step is to convert that to True Airspeed (TAS) and to do that you need to find the speed of sound at your target altitude.
If Altitude > 36,089, then Speed of Sound = 573 nm/hr
Otherwise
Mach to TAS
If you are cruising in Mach, you need to convert that to TAS.
Range Economy
You can find your range economy given the following variables:
FF — Fuel Flow (pounds per hour), average in cruise
FC — Fuel Cost ($ per gallon)
FD — Fuel Density (pounds per gallon)
D — Distance to cruise (since the climb and descent fuel will be about the same, we consider only the cruise portion)
TAS — True Air Speed during cruise
VA — Variable Airframe costs ($ per hour)
VC — Variable Crew costs ($ per hour)
VE — Variable Engine costs ($ per hour)
WF — Wind Factor (positive numbers for headwinds, negative for tailwinds)
G450 Example
If you consider a G450 cruising at 37,000 feet on a 3,000 nm leg, in a 100 knot headwind at 70,000 lbs and ISA, average fuel flow will be 2,966 PPH (M 0.77), 3,178 PPH (M 0.80), and 3,593 PPH (M 0.83). If the fuel costs $3 per gallon and has a density of 6.5 gallons per pound, and the variable costs are as shown:
| Mach | No Variable Costs | $1,000 Variable Costs | $3,000 Variable Costs |
| M 0.77 | $12,035 | $20,828 | $38,413 |
| M 0.80 | $12,278 | $20,648 | $37,389 |
| M 0.83 | $13,245 | $21,233 | $37,207 |
As fuel costs drop, other variable costs become increasingly important. In the example shown it doesn't make sense to speed up in a headwind when there are no other variable costs. That makes sense, the faster you go the more fuel you burn. But as variable costs other than fuel increase, there comes a point where it pays to speed up because fuel would be cheaper than the other variable costs. Let's say you paid you crew by the hour and had a maintenance program billable by the hour. If those variable costs came to $3,000 per hour you end up better off speeding up, as shown.
4
Endurance performance
Endurance performance, from ATCM 51-3, figure 2.27.
Since the fuel flow of the turbojet powered airplane is proportional to thrust required, the turbojet airplane will achieve maximum specific endurance when operated at minimum thrust required or (L/D)MAX. In subsonic flight, (L/D)MAX occurs at a specific value of lift coefficient for a given airplane and is essentially independent of weight or altitude.
The specific fuel consumption of the turbojet engine is strongly affected by operating RPM and altitude. Generally, the turbojet engine prefers the operating range near normal rated engine speed and the low specific fuel consumption. Thus, increased altitude provides the the favorable lower inlet air temperature and requires a greater engine speed to provide the thrust required at (L/D)MAX. The typical turbojet airplane experiences an increase in specific endurance with altitude with the peak values occurring at or near the tropopause.
Source: ATCM 51-3, pg. 172
Your best endurance occurs at the bottom of the tropopause (minimum temperature) and at the lower thrust settings needed to achieve L/DMAX speeds.
5
Off optimum
Increasing altitude has a powerful effect on both range and endurance of the turbojet airplane. As a result of this powerful effect, the typical turbojet airplane will achieve maximum specific endurance at or near the tropopause. Also, the maximum specific range will be obtained at even higher altitudes since the peak specific range generally occurs at the highest altitude at which the normal rating of the engine can sustain the optimum aerodynamic conditions.
Source: ATCM 51-3, pg. 175
6
G450 examples
G450 Endurance versus Range
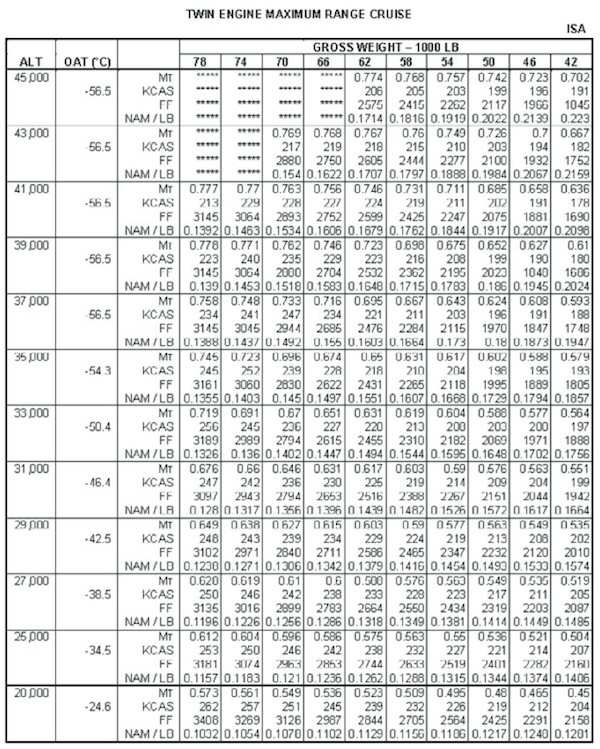
G450 Twin engine maximum range cruise ISA, from G450 Aircraft Operating Manual, §11-04-00, figure 15.
G450 maximum range speeds are given in Section 11 of the Aircraft Operating Manual. At 41,000', ISA, 62,000 pounds gross weight, for example, maximum range speed is 0.746 Mach and fuel consumption will be 0.1679 nautical air miles per pound. True airspeed under those conditions would be 427 nautical miles per hour so we can expect to burn 2,543 lbs of fuel.
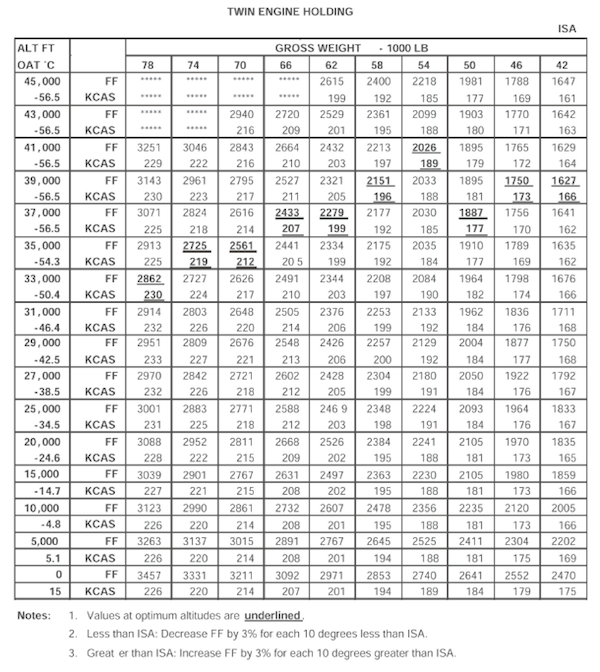
G450 Twin engine holding ISA, from G450 Aircraft Operating Manual, §11-04-50, figure 46.
G450 maximum endurance speeds are also given in Section 11 of the Aircraft Operating Manual. At 41,000', ISA, 62,000 pounds gross weight, for example, maximum endurance speed is 203 KCAS and fuel flow is 2,432 lbs per hour. So we know we will burn 111 lbs less fuel than at maximum range. 203 KCAS at 41,000 feet under ISA conditions comes to 399 KTAS.
For at least our sample data point, flying at maximum range will cost us about 110 lbs of fuel per hour more but gains almost 30 nautical miles.
G450 Weight Impact on Range
G450 Twin engine maximum range cruise ISA, from G450 Aircraft Operating Manual, §11-04-00, figure 15.
Using the same twin engine maximum range chart as before, we see that an increase in weight requires a higher Mach number and results in a lower nautical air miles per pound.
G450 Altitude Impact on Range
An increase in altitude also requires a higher Mach number, but results in higher nautical air miles per pound.
Wind impact on G450 range
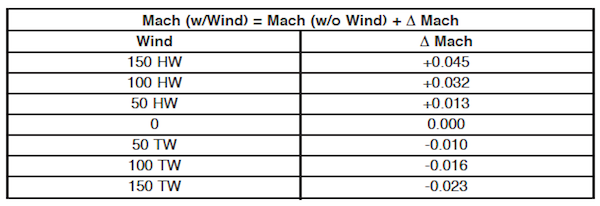
G450 Maximum range Mach wind adjustments, from G450 Aircraft Operating Manual, §11-04-30, ¶2.
The G450 operating manual has a wind adjustment chart for maximum range that appears to back up the theory. But running the numbers for a 100 knot headwind and our previous example condition (41,000 feet, 62,000 lb. gross weight, ISA) the numbers do not agree:
- No wind, Mach 0.746, 420 TAS, 420 GS, 0.1679 NAM, 2501 PPH, 1.00 hour to fly 420 nm, 2501 lbs to fly 420 nm
- 100 knot headwind, Mach 0.746, 420 TAS, 320 GS, 0.1679 NAM, 2501 PPH, 1.31 hour to fly 420 nm, 3281 lbs to fly 420 nm
- 100 knot headwind, Mach 0.778, 435 TAS, 335 GS, 0.1646 NAM, 2642 PPH, 1.25 hour to fly 420 nm, 3313 lbs to fly 420 nm
Using the operating manual recommended adjustment does not improve range with a 100 knot headwind. Of course the theory states you need at least a 25% increase over the zero wind velocity. The zero wind velocity in this example is Mach 0.746, 420 TAS, so we are asked to consider at least a 100 knot headwind, which I have done. (The recommended speed for the 150 knot headwind adjustment exceeds the aircraft's capability at 41,000'.)
What about a 100 knot tailwind and our previous example condition (41,000 feet, 62,000 lb. gross weight, ISA)?
- No wind, Mach 0.746, 420 TAS, 420 GS, 0.1679 NAM, 2501 PPH, 1.00 hour to fly 420 nm, 2501 lbs to fly 420 nm
- 100 knot tailwind, Mach 0.746, 420 TAS, 520 GS, 0.1679 NAM, 2501 PPH, 0.81 hour to fly 420 nm, 2020 lbs to fly 420 nm
- 100 knot tailwind, Mach 0.730, 419 TAS, 519 GS, 0.1678 NAM, 2497 PPH, 0.81 hour to fly 420 nm, 2023 lbs to fly 420 nm
Here again you would be better off leaving the speed alone.
Note: if you want to replicate these numbers, all the information you need is on the Twin Engine Air Specific Range for 41,000 FT at ISA Day chart, G450 AOM, §11-04-00, Figure 39.
7
Conclusions
Based on the theory in several aerodynamics and aeronautical engineering textbooks, tempered with real life experience, I've come to the following conclusions:
- Maximum endurance speed gives you the most time in the air per pound of fuel. That speed occurs when fuel flow is at a minimum and at L/DMAX and on most airplanes that can be found at an angle of attack at 0.30.
- Maximum range speed gives you the most distance per pound of fuel. There is no easy gauge in the cockpit to judge this but it can be approximated by adding a third to your maximum endurance TAS.
- As gross weight decreases, the TAS required to fly maximum range decreases, the thrust required decreases, and the fuel burn decreases.
- Increasing altitude requires an increase in thrust and velocity to achieve a newer maximum range profile, which should burn less fuel. Maximum endurance tends to occur where the tropopause begins. Maximum range occurs at a higher altitude but depends greatly on engine efficiency at high altitudes.
- There appears to be little or no advantage in adjusting maximum range Mach for wind conditions.
References
(Source material)
Air Training Command Manual 51-3, Aerodynamics for Pilots, 15 November 1963
Connolly, Thomas F., Dommasch, Daniel 0., and Sheryby, Sydney S., Airplane Aerodynamics, Pitman Publishing Corporation, New York, NY, 1951.
Dole, Charles E., Flight Theory and Aerodynamics, 1981, John Wiley & Sons, Inc, New York, NY, 1981.
Gulfstream G450 Airplane Flight Manual, Revision 35, April 18, 2013.
Gulfstream G450 Aircraft Operating Manual, Revision 35, April 30, 2013.
Please note: Gulfstream Aerospace Corporation has no affiliation or connection whatsoever with this website, and Gulfstream does not review, endorse, or approve any of the content included on the site. As a result, Gulfstream is not responsible or liable for your use of any materials or information obtained from this site.