The tropopause is important to us who fly below, in, or above it because so much happens below, in, or above it.
— James Albright
Updated:
2016-10-08
Our aircraft performance changes as temperature changes and that tends to happen as we climb until we get to the tropopause. Many cloud types will stop at the tropopause. Weather fronts can be capped off by the tropopause. The jet stream is impacted by the tropopause and extreme shear levels can occur where the tropopause suddenly breaks with latitude. It is something we need to pay attention to!
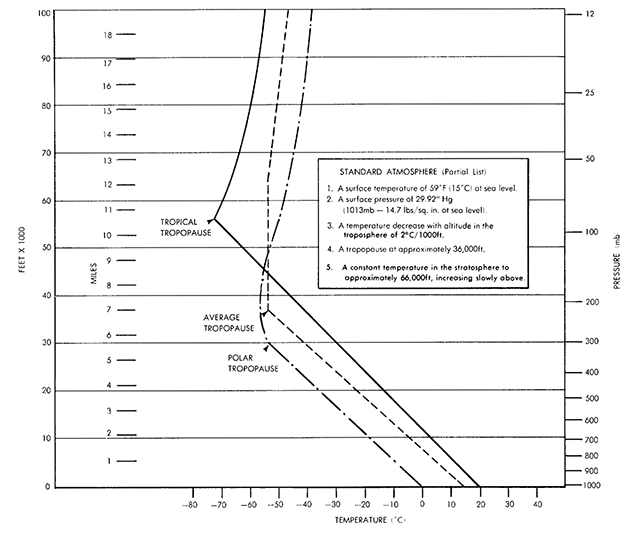
Tropopause height, from Meteorology Training, pg. 1-5
2 — Features of the tropopasue

1
Demarcation
Generally speaking, the tropopause begins when the temperature lapse rate of the troposphere ends . . .
Troposphere Decrease in Temperature with Height, from AFH 11-203, figure 1-4
2
Features of the tropopause
Most of the atmosphere’s moisture is concentrated in the troposphere, and is rarely found in significant amounts above the tropopause.
Source: AFH 11-203, ¶2.1
Temperature normally decreases with increasing altitude throughout the troposphere. This decrease of temperature with altitude is called the lapse rate, expressed in degrees per thousand feet. The standard lapse rate in the troposphere is 2 degrees C (3.6 degrees F) per 1,000 feet. This value serves as the basis for calibrating aircraft instruments and preparing performance charts. [ . . . ] Variation in the lapse rate may change with altitude. At a given time and place, the vertical temperature might decrease at a rate of 3°C per 1,000 ft from the ground to an altitude of 5,000 ft, at a rate of 1°C per 1,000 ft between 5,000 and 7,000 ft, and at 2°C per 1,000 ft above 7,000 ft until the tropopause is reached. Rarely does the temperature decrease at an orderly rate. In fact, temperature inversions are common in the troposphere, where temperature increases with height.
Source: AFH 11-203, ¶3.6
- The troposphere extends from the surface up to an average height of 11 km. Within the layer, temperatures generally decrease as altitude increases.
- It is an area of relatively low stability where the over-turning of air is frequent. It holds virtually all the water vapour in the atmosphere and is the layer where most flying occurs.
- The troposphere contains over 75% of the mass of the total atmosphere.
- The upper boundary of the troposphere is known as the tropopause. It separates the troposphere from the stratosphere. The temperature ceases to decrease with height at the boundary of the tropopause.
- The height of the tropopause varies with latitude, season of the year, and the weather conditions.
- The tropopause is lowest over the poles (approximately 26 000 ft or 8 km) and highest over the equator (approximately 52 000 ft or 16 km). Its average height is 36 090 ft (11 km) at about 45° latitude.
- Since the thickness of the troposphere is determined by the amount of solar energy and the vertical mixing, the tropopause is lower over areas where the air is cold than where it is warm.
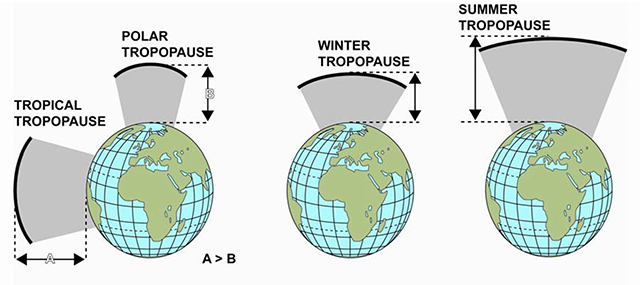
- The left-hand picture [top of page] shows that the tropical tropopause height is greater than the polar tropopause height. The right hand picture shows that, for a given region such as the poles, the summer tropopause is higher than the winter tropopause.
- As the temperature decreases with height, so the temperature at the tropopause over the poles will be higher than over the equator because the tropopause is closer to the ground here. This is the opposite situation to the surface temperature.
- Typically, the tropopause temperature is -50°C over the poles and -80°C over the equator.
- Another feature of the tropopause is that, rather than show a gradual change in height between the equator and the poles, there are breaks in the tropopause where large temperature differentials occur.
Source: Meteorology, pg. 1-4
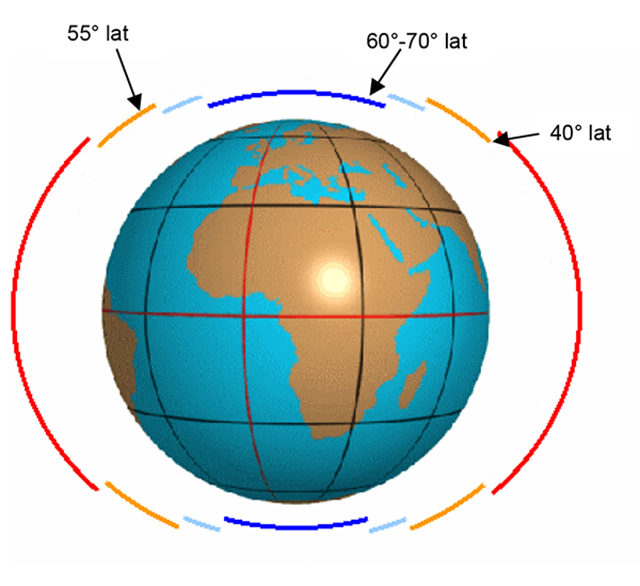
Tropopause breaks, from Meteorology Training, pg. 1-6
- The first of these breaks occurs at about 40° latitude, where warm air circulating from the equator meets colder air from higher latitudes. The second break is at 55° latitude, where tropical air meets polar air. The third break is between 60° and 70° latitude, where polar air meets arctic air. This break is more common in the Northern Hemisphere.
- The presence of these breaks can cause strong winds called jet streams.
Source: Meteorology, pg. 1-4
3
Jet streams and the tropopause
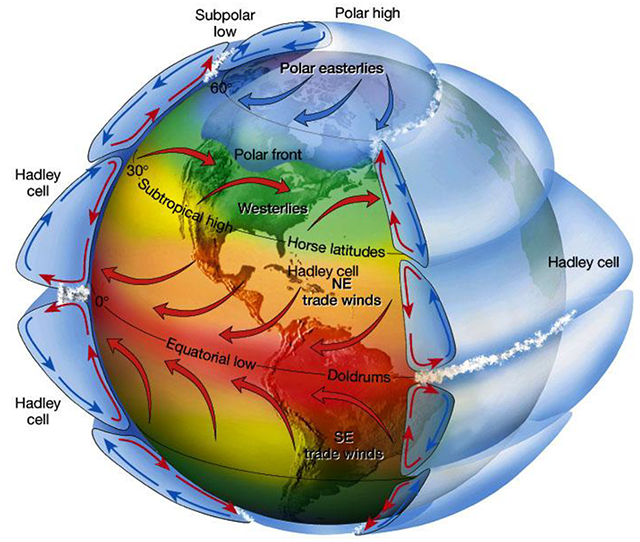
Three-cell model of the earth's circulation, from AFH 11-203, figure 5.1
Using the three-cell model [ . . . ] we see that the various circulations due to unequal heating combine to create the jet streams that are centered at 30°N/S and 60°N/S on average but constantly meander north and south. Winds generally increase with height through the troposphere due to the presence of a north-south temperature gradient in the mid-latitudes and the conservation of angular momentum, reaching a maximum near the tropopause. This wind maximum is called the jet stream. A jet stream, or "jet", is a meandering region of concentrated, higher wind speeds that circles the Earth. In the wintertime, there are often two or three predominant jet streams: the polar-front jet (PFJ) stream, the subtropical and the arctic jet streams. The main and best known jet stream is the polar-front jet stream which frequently enhances major weather system development in the mid-latitudes. Within the jet stream are concentrated pockets of the strongest winds, often called jet stream maxima or simply a "jet max". The strongest vertical motions associated with jet streams occur under jet maxima, and these motions are a major factor in the development of low pressure systems.
Source: AFH 11-203, ¶5.3
Because the height of the troposphere can change suddenly, as shown earlier, a jet stream is often located at these breaks in the temperature lapse rate.
4
Clear air turbulence
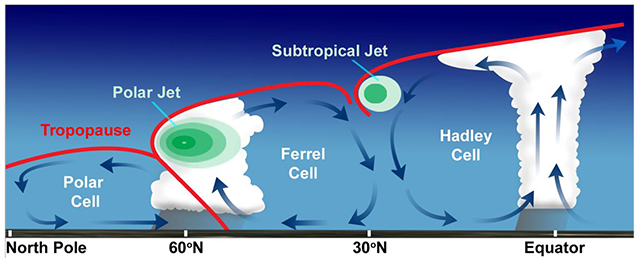
Location of Polar/Subtropical Jet Streams in Relation to Tropopause, from AFH 11-203, figure 9.15
The tropopause is often a region of turbulence because of the marked variations in vertical motions which occur in, at, or below it. The tropopause is often devoid of clouds, so that turbulence encountered there will frequently be classified as clear air turbulence. Earlier we discussed the tropopause is higher at the equator than at the poles. However, there are generally two breaks in the tropopause--one between the arctic and polar air masses, and one between the polar and tropical air masses (Figure 9.15). It is where these breaks in the tropopause appear that a very important flight factor can be found--the jet stream.
Source: AFH 11-203, ¶9.10
If jet stream turbulence is encountered in a crosswind, it is not so important to change course or flight level. However, if it is desired to traverse the CAT area more quickly, either climb or descend after watching the temperature gauge for a minute or two. If the temperature is rising--climb; if it is falling--descend. This maneuver will prevent following the sloping tropopause or frontal surface and thereby staying in the turbulent area. If the temperature remains the same, you can either climb or descend.
Source: AFH 11-203, ¶9.13.3
5
Thunderstorms
- The height of the tropopause is important when analyzing potential severity of a thunderstorm. The tropopause height will vary with latitude and the season of the year. The tropopause height is higher in summer and lower in winter. The height is also higher at the equator and lower at higher latitudes. The tropopause acts as a barrier to resist the exchange of air between the troposphere and the stratosphere.
- The tropopause will prevent a thunderstorm from continuing to build, acting as a lid on further vertical development. Only the most severe thunderstorms with rapidly rising updrafts have enough kinetic energy to penetrate the tropopause before cooling and slowing down. Remember that the tropopause height does change seasonally and regionally. A springtime 30,000-foot thunderstorm in Germany is potentially as deadly as a 50,000-foot mid-west US thunderstorm in summertime. There is a rough correlation between the degree of tropopause penetration and thunderstorm severity: the greater the tropopause penetration, the more severe the storm.
Source: AFH 11-203, ¶13.5
6
Weather charts
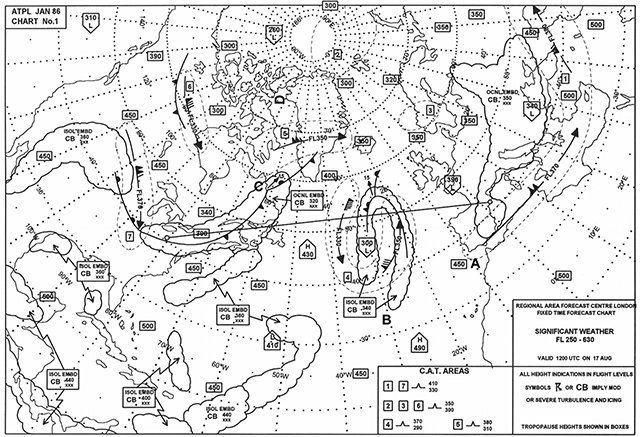
Significant Weather Chart, from Meteorology Training, pg. 24-5
- The [Significant Weather] chart covers a considerable area of Europe, the Middle East, North Africa, and North America. These charts are issued in advance of their valid times, which are 0000, 0600, 1200, and 1800 UTC. The validity of this [example] chart is 1200 UTC on 17 August. A Polar Stereographic or Mercator projection is used for all middle and upper air significant weather charts.
- The bottom right hand corner of this chart gives a box which:
- Indicates the issuing station.
- The type of chart – Significant Weather.
- The depth of the atmosphere covered. In this case FL 250 - 630 this is also given in hPa.
- The chart is a fixed time chart for 1200 UTC, 17 August.
- The units used on the chart are Pressure Altitude (Hectofeet), knots, and °C .
- The bottom right box indicates that all heights are Flight Levels. Tropopause heights are shown in boxes on the chart (Indicated by A on the chart). The symbols and CB imply moderate or severe turbulence and icing.
- The vertical distance at which phenomena are expected are indicated by flight levels, top over base or top followed by base . 'XXX' means the phenomenon is expected to continue above or below the vertical coverage of the chart (Indicated by B on the chart).
- The surface positions together with the direction and speed of movement of pressure centres and fronts are denoted as shown on the chart. Where slow is used this indicates movement of less than 5 kt (Indicated by C on the chart). Dashed lines denote areas of CAT. These areas are numbered and are associated with the decode box on the chart in the bottom right corner (Indicated by D on the chart). (e.g. Area 4 Moderate turbulence FL 370 to FL 300).
- On lower charts the 0°C Isotherm is also shown as a dotted line with the FL indicated(e.g.------- 0°C:FL130--------).
Source: Meteorology, pg. 1-4
You can get a "Mid Level SigWx (FL 100-450)" chart from www.aviationweather.gov. For example:

Significant Weather Chart, from www.aviationweather.gov
References
(Source material)
Weather for Aircrews, Air Force Handbook (AFH) 11-203, Volume 1, 1 March 1997, Department of the Air Force
Meteorology, JAA ATPL Training, Jeppesen Sanderson Inc., 2004