Have you ever been “Behind the Power Curve?” What does this mean? Why is this important for someone flying a modern aircraft with all the latest safety features?
— James Albright

Updated:
2026-04-15
Before we answer those questions, we need to talk about something rarely talked about in polite aviator company: the regions of normal and reversed command. And before that, we need to talk about thrust versus power.
1 — The regions of reversed and normal command
3 — The case of West Caribbean Airways 708
4 — The case of Air Algérie 5017
5 — Avoiding life behind the power curve (and what to do if you find yourself there)

1
The regions of reversed and normal command
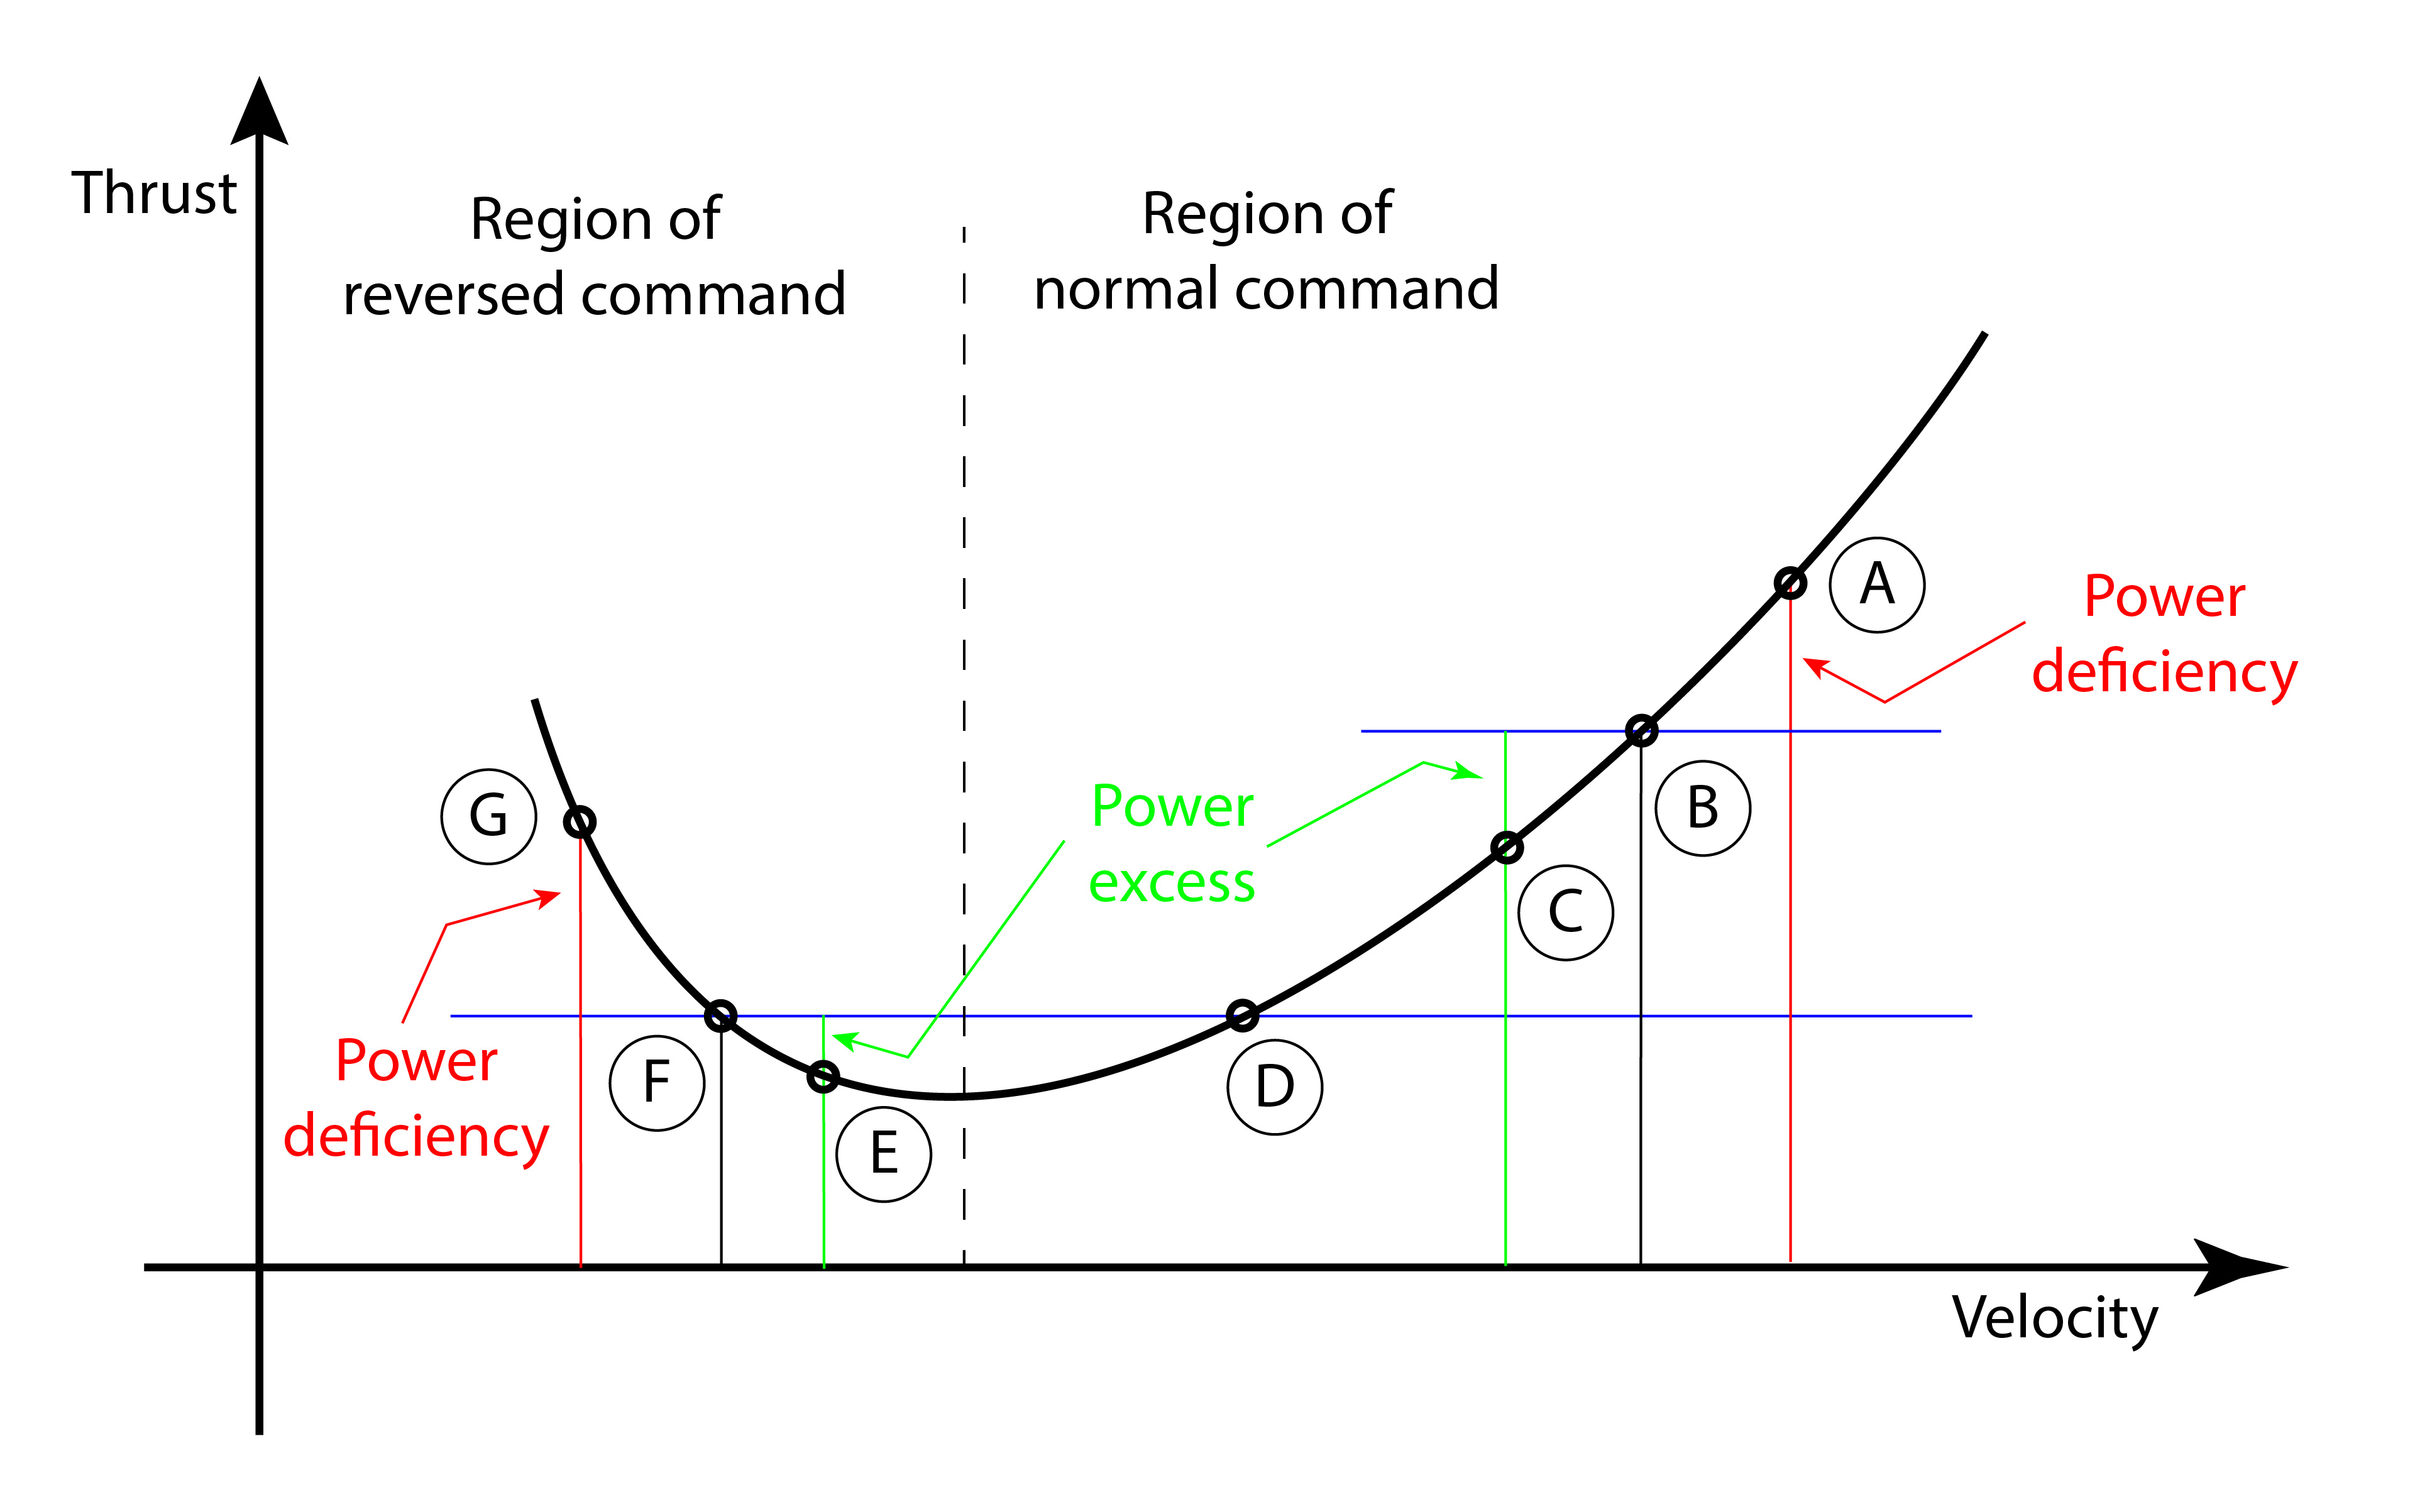
Regions of reversed command (My drawing)
Note the vertical axis is labeled “Thrust” and you will often read in aeronautical texts the terms “Thrust Curve” used as well as “Power Curve.” They are theoretically different. A pure turbojet – a jet engine without a fan and bypass air – will have a curve that bottoms out at L/D-max, the point where the ratio of lift over drag is greatest. A pure propeller driven airplane – one without any forward thrust influence of a jet engine – will have a curve that bottoms out before L/D-max. For an aeronautical engineer, the distinction is important. In actual practice, most modern jet engines have fans that act like propellers and many aircraft with propellers have jet engines connected to that propeller. For us pilots, the distinction is not important, and accident reports tend to mention “power curve” when referring to aircraft with jet engines. So we’ll use “power curve” even when “thrust curve” may be more appropriate.
The chart is divided into two regions based on thrust versus velocity. At higher velocities, the aircraft reacts as you expect, you know, normally. For any given velocity in level flight, adding thrust causes the aircraft to accelerate, reducing thrust causes you to decelerate. This is the region of normal command. You should spend most, if not all, of your flying career in this region. If you get too slow, you will find yourself in the region of reversed command. Now things don’t work the way you expect. Let’s consider an example, flying a jet in level, unaccelerated flight. The thrust versus velocity curve shows there are one or two combinations of thrust and velocity to produce level, unaccelerated flight.
Let’s look at Point B as a starting point. Now imagine turbulence, thermal, or other effects result in a gain of velocity and accelerate the aircraft to Point A. You no longer have enough thrust to maintain the present velocity, so the aircraft returns to the original speed. Similarly, if the conditions result in slowing the aircraft to Point C, you now have more thrust than needed, so the aircraft will accelerate and return to Point B. You can also imagine that you, the pilot, want to accelerate from Point B to Point A. Simple: add thrust. Or you want to decelerate from Point B to Point C. Simple again: reduce thrust. The aircraft behaves as you expect. That is, you have normal command.
Now let’s say you are at Point C and want to slow to Point D. Since you still have normal command, you need only reduce thrust until at the desired speed. At that point, you add thrust, but not as much as you had at Point C. It takes less thrust to fly slower, as you expected.
Now consider you’ve slowed to Point F. Notice that it takes just as much thrust to fly at this slower speed as it did to fly a Point D. If you want to slow to Point G, reducing thrust will get you there, but you will need considerably more thrust to hold this speed. If you don’t have enough thrust to do this, you will have to reduce your angle of attack or stall.
Why this matters
You may wonder how you could ever end up in the region of reversed command in an aircraft with a stick shaker, pusher, nudger, or whatever magic your aircraft possesses to keep you from stalling. Perhaps looking at several case studies can prove that even with these kinds of stall barriers, understanding the dangers of being behind the power curve applies to you too.
2
The case of Austral 2553

Austral 2553
Austral Líneas Aéreas was a domestic subsidiary of Aerolineas Argentinas which operated a fleet of McDonnell Douglas DC-9 and MD-80s. The flight was late at night and there was significant convective activity along the route of flight.
Date: October 10, 1997
Time: 2210
Type: McDonnell Douglas DC-9-32
Operator: Austral Líneas Aéreas
Registration: LV-WEG
Fatalities: 5 / 5 crew, 69 / 69 passengers
Aircraft Fate: Destroyed
Phase: En route
Airport (Departure): Libertador General José de San Martín Airport (SARP)
Airport (Arrival): Buenos Aires-Jorge Newbery Airport, BA (SABE)
The pilots
The captain was a 40-year-old Argentine national with over 9,000 hours total time, of which only 223 were in type. He did, however, have many hours in the MD-80 series. The first officer was also a 40-year-old Argentine national, with considerably less total time, just under 3,000 hours. But the first officer had nearly 1,400 hours in type.
The flight (to the region of reversed command)
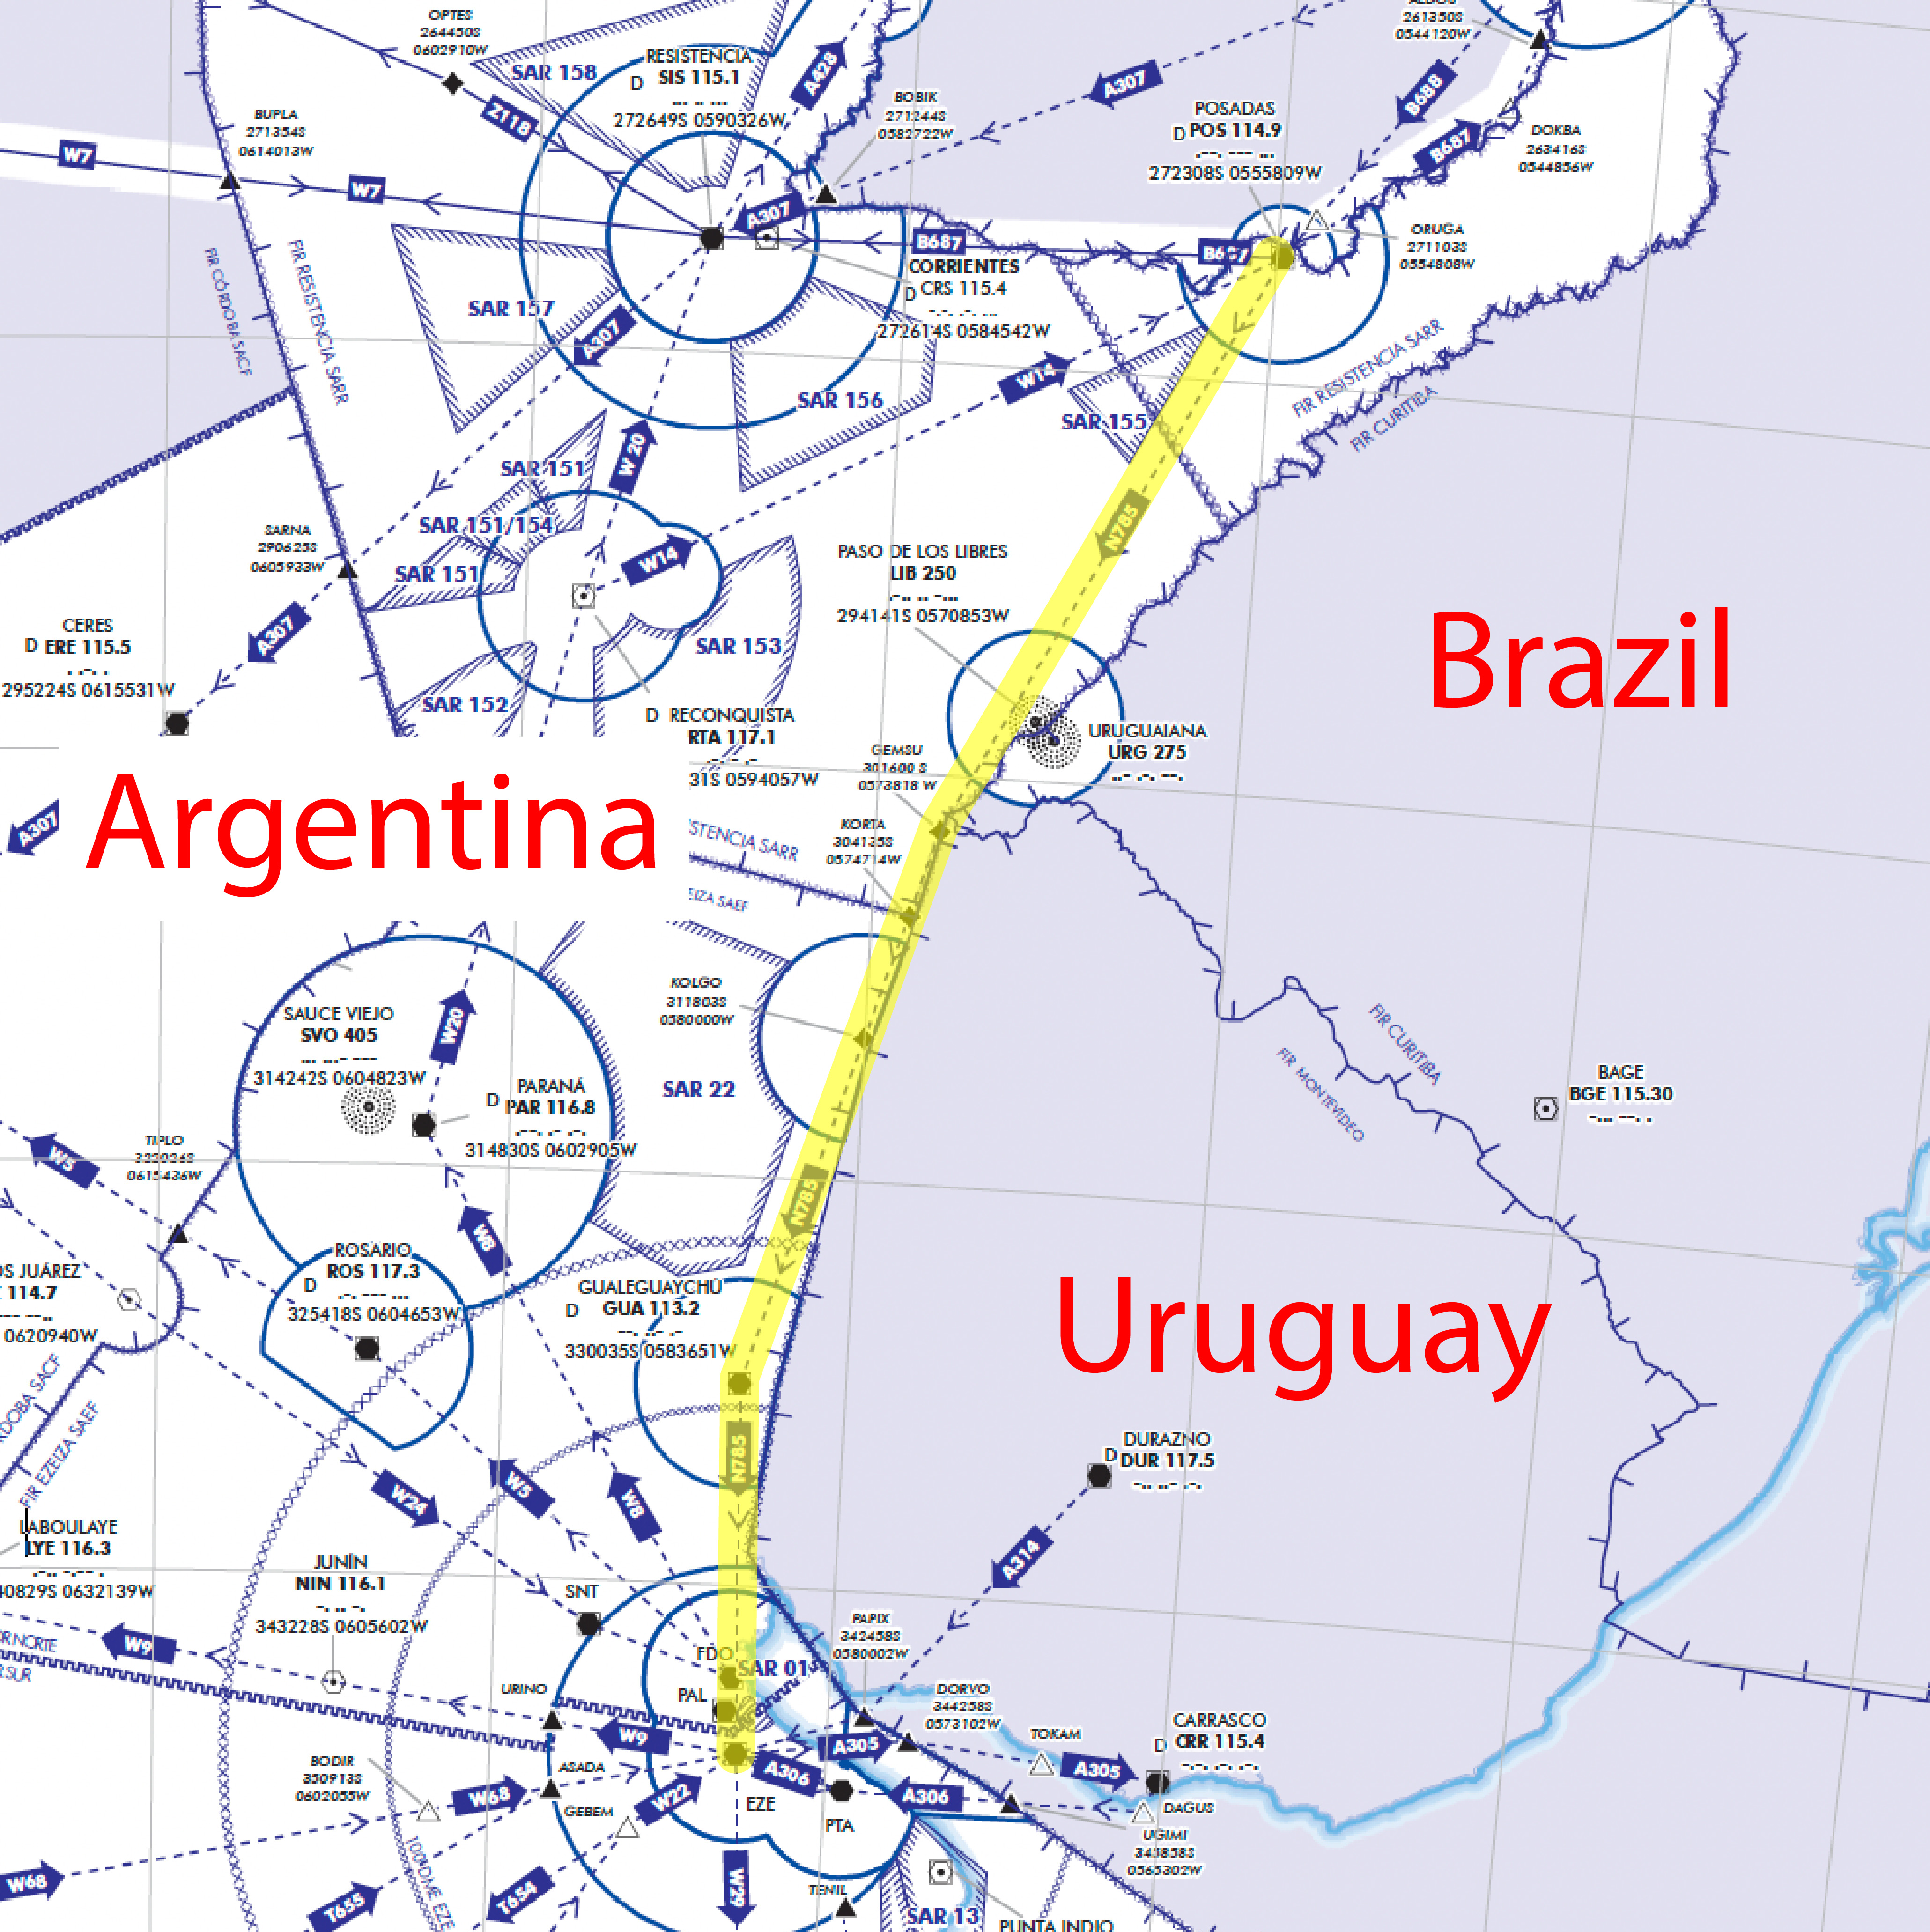
Route placed on en route chart (current day chart from Argentine AIP)
Their dispatchers had filed a route designed to keep the airplane in Argentine airspace. The route was defined by ground-based navaids, but the Gualeguaychú VOR (GUA on the chart) was NOTAM’d out of service. This fact and the weather made the selected route inappropriate. In fact, it could be argued that the flight should never have been allowed to depart.
Relevant operational aspects were not considered during dispatch, including:
Meteorological information, which resulted in:
a) Planning a route largely affected by adverse weather, requiring descent within an instability line.
b) Selecting alternate airports with adverse forecast weather conditions at the planned time of use.
c) Deviation from the planned route due to inability to maintain it.
Navigation aid information, as NOTAMs affecting the route were not known. Navigation aids along the route of flight AU2553 were operational, except for the Gualeguaychú VOR, which was out of service.
Source: DINACIA, 3. Conclusions, para 5. (Translated by ChatGPT)

Significant convective activity (DINACIA, p. 151)
The takeoff was at 2118, with the first officer as pilot flying. It was a short flight with less than a full cabin; performance was good to level off at FL340. The crew noticed weather on radar and elected to deviate left of course without reporting this to air traffic control. They later noticed the line of weather was very long, but they did not consider further deviation.
What caused the flight to lose control (Uruguayan version)
According to the Uruguayan report, the pitot tubes became blocked by high altitude icing.
From approximately 22:04:20 onward, due to total or partial obstruction of the pitot tubes, FDR airspeed data and cockpit airspeed indications did not correspond to the aircraft’s true airspeed.
Source: DINACIA, 3. Conclusions, para 18. (Translated by ChatGPT)
I’m not sure this makes sense, because the airspeed continued to decrease as the altitude decreased. They didn’t notice the decay in airspeed until they had begun their descent. They decreased the pitch slightly and added thrust, but still the airspeed decreased. They then applied anti-ice, perhaps thinking the loss of speed was due to a contaminated wing. The captain belatedly requested descent from the Argentine controllers, who informed them they were actually in Uruguayan airspace. By now, they were descending at over 4,000 feet/minute and still losing speed. The captain finally recognized the increasing sound of the air over the cockpit as an indication that they were actually flying too fast and directed the first officer to slow down. But the first officer, for some reason, didn’t hear that and asked for the slats, thinking they were dangerously slow.
At this point they were at 33,000 feet and indicating 220 KIAS. Uruguayan investigators concluded they were actually flying at 340 KIAS / Mach 0.84. The aircraft was equipped with a combination airspeed / Mach Number indicator with one needle. The needle showed KIAS below 250 KIAS and then pointed at a rotating scale showing Mach Number. Below 250 KIAS, the Mach Number could not be viewed.

Airspeed indicator issue (DINACIA, p. 73)
This disparity became important, because the slats were used for stall recovery only for low altitudes, partly because they were airspeed limited at 280 KIAS / Mach 0.57. The captain continued trying to contact ATC for descent, apparently not hearing the first officer’s repeated request for slats. The first officer finally extended the slats on his own. Uruguayan investigators believed that some of the slats were ripped off the airplane causing a loss of control. The aircraft rolled over into a spiral dive.
What caused the flight into the region of reversed command (Argentinian version)
There is a second accident report out, but I haven’t been able to find it. I have heard it discussed by Petter Hörnfeldt at Mentour Pilot
.There was no pitot tube ice blockage and the indicated airspeed was correct. The chances of all three pitot tubes freezing up at the same time and same way was very unlikely.
The combination of flying at 35,000 feet and the available thrust left the airplane behind the power curve.
With the autopilot in altitude hold mode, the pitch would come up in this situation, raising the angle of attack and causing the airspeed to further decrease. The situation was made worse when the captain selected engine and wing anti-ices on, further reducing the thrust.
In this situation, the aircraft’s maximum performance ceiling decreased to 33,000 with engine anti-ice on and 32,000 with engine and wing anti-ice on.
While descending through 31,000 feet at 220 KIAS, the Mach Indicator was not in view but they were doing Mach 0.63, above the slat limit speed, but not enough to rip them off the airplane. Deploying the slats at that speed however, would induce a large pitch down moment, with enough gyrations to cause the relative wind to hit the pitot tubes obliquely, creating erroneous low airspeed indications.
Source: Argentine Accident Report, as read by Petter Hórnfeldt
Petter Hónfeldt believes what really happened was that high altitude ice crystals blocked the engine inlet pressure sensors, causing the autothrottles to reduce thrust. He concludes the Argentine report was closer to the truth.
The flight’s conclusion
Regardless of how they got into the spiral dive, the pilots were unprepared to recover. They had never received training on how to deal with unreliable airspeed indications, unusual attitudes recovery, or with Crew Resource Management. The dive continued, reaching a descent rate of 34,000 feet/minute. The aircraft slammed into the Uruguayan countryside nose first, killing all on board and carving out a DC-9 shaped crater almost 6 meters deep.
While the Uruguayan report cites the pitot tube blockage and the first officer’s selection of slats, and the Argentine report cites the crew flying the airplane behind the power curve, the recommendations closely track:
Crews should be trained for high altitude stalls.
Crews should be trained to recognize and deal with pitot-static failures and other causes of unreliable airspeed indications.
Crews should be trained in upset recovery.
Crews should receive Crew Resource Management training.
3
The case of West Caribbean Airways 708
JIAAC-9-058-2005, fig. 2
Date: August 16, 2005
Time: 0300
Type: McDonnell Douglas DC-9-82 (MD-82)
Operator: West Caribbean Airways
Registration: HK-4374X
Fatalities: 9 / 9 crew, 151 / 151 passengers
Aircraft Fate: Destroyed
Phase: En route
Airport (Departure): Panama City-Tocumen International Airport (MPTO)
Airport (Destination): Martinique Aimé Césaire International Airport, Fort-de-France, Martinique, France (TFFF)
Medellin-based West Caribbean Airways was a troubled charter service in continuous financial trouble. The airline had a previous accident that same year. Of particular note, the airline started in 1999 flying ATR-42s, and LET-410 turbo props, both relatively low altitude airplanes with straight wings. Two years before this accident flight, they acquired McDonnell Douglas MD-81s, aircraft with jet engines, swept wings, and capable of higher altitudes. The airline had been fined by the Colombia civil air authorities for overloading aircraft, ignoring duty time limits, and failing to provide required crew training. Among missing training courses were those in Crew Resource Management and high altitude stall recovery.
The pilots
The captain was a 40-year-old Colombian with nearly 6,000 total hours of which just over 1,100 was in type. The first officer was a 21-year-old Colombian with almost 1,400 total hours of which nearly 900 was in type. The airline had not paid any of their pilots for the six months prior to the accident, but the pilots continued to work in hopes of someday getting back pay. The captain had a second job to make up for the loss of pay.
The flight (to the region of reversed command)
On the evening of the accident flight, dispatchers did not provide any weather forecasts. The departure was delayed by two hours because the company had to scramble to find ways to pay for the aircraft’s fuel. But the aircraft eventually departed, with nearly full fuel. The delay pushed the flight into the Window of Circadian Low, between 0200 and 0600.
They departed Panama City at 0058 Local and climbed to their planned cruising altitude of FL310, which would have been close to the maximum altitude with engine and wing anti-ices on, under most conditions. As they approached FL310, they selected Mach 0.75 for their cruise speed.
At 0126 Local the autopilot switched to altitude hold mode. They then noticed lightning in the night sky and turned the engine anti-ice on. They requested and received clearance to deviate left of course for weather.
What caused the flight into the region of reversed command
At 0139 Local the crew requested and received clearance to climb to FL330, either forgetting or not understanding this would be above their performance capability at their weight with the engine anti-ice on. They set the “speed on pitch” mode of their autopilot, something also called “flight level change” in other aircraft. This maintained their Mach 0.75 speed with pitch changes, but resulted in almost no climb rate because they were almost at their thrust limited altitude. After about a thousand feet the aircraft leveled off. The pilot selected the Vertical Speed mode of the autopilot and 500 ft/min, now prioritizing the climb over maintained speed, which started to decrease. They turned their engine anti-ice off in an effort to preserve their speed, which slowly increased to Mach 0.75. Once level, they reduced their thrust rating panel from climb to cruise. They further reduced available thrust by selecting engine and wing anti-ice on. They were now 2,000 feet above their cruise altitude limit given their weight. In altitude hold, the aircraft began to decelerate again, falling behind the power curve.
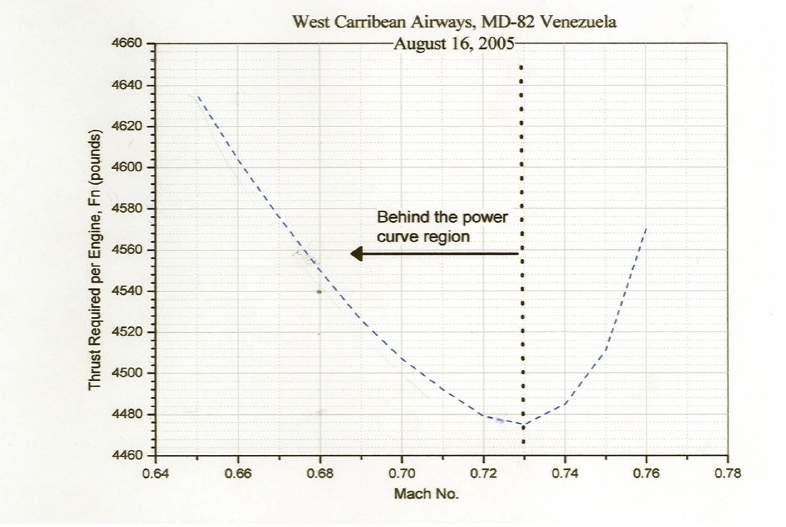
JIAAC-9-058-2005, fig. 25
The flight’s conclusion
Once behind the power curve at high altitudes, the only way to get ahead of the power curve is to reduce angle of attack. Faced with decreasing speed, the crew began a descent back to FL310, but did so slowly, keeping them on the back side of the power curve. A few minutes later, they turned the anti-ice off, but they were so far behind the power curve that this didn’t help. They turned the engine and wing anti-ice back on.
At 06:57 Local the flight crew requested permission to descend to FL310, which was approved. The autopilot was disconnected and the airplane started to descend gently. But the pitch wasn’t lowered enough and the aircraft continued to lose speed. As the airplane descended past about FL315, the airspeed continued to decrease and the engine EPR decreased to about flight idle. Investigators surmised that this was because the angle of attack was so high, the airflow to the engines was disrupted by the wings.

JIAAC-9-058-2005, fig. 53
Shortly thereafter, the stick shaker activated followed by the aural warning, “Stall! Stall!” The first officer recognized this, calling out “It’s a stall!” The captain’s reaction was to instruct the first officer to request a further descent. As the descent accelerated, the captain said, “we have two engines flamed out.” That wasn’t true. The captain continued to pull back as the descent rate increased.
The aircraft descended at 7,000 feet/minute and finally crashed in a swampy area. The entire descent from FL330 had taken about 3 minutes and 30 seconds. The descent rate increased to over 12,000 feet/minute. The aircraft impacted with a nose high attitude, completely destroying the aircraft and killing everyone on board.
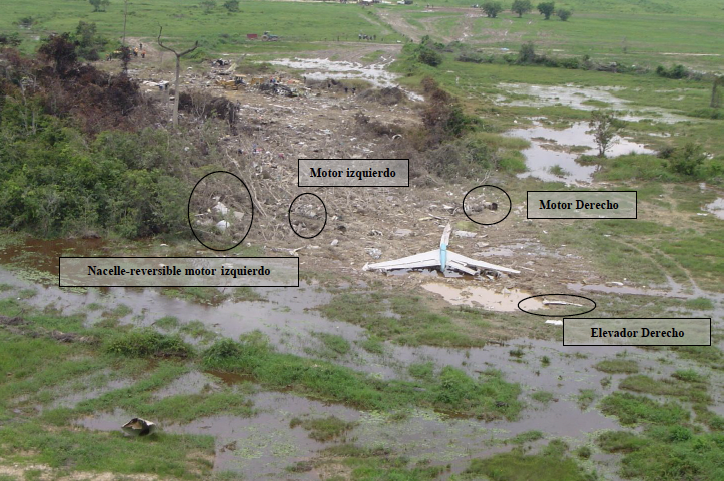
JIAAC-9-058-2005, fig. 1
Investigators clearly blamed the crew for flying the aircraft into a performance-limited state and failing to properly recover from a stall. They also cited poor CRM and decision-making as the emergency developed. I would add that the pilots didn’t understand the back side of the power curve and were never trained in high altitude stall recovery.
4
The case of Air Algérie 5017
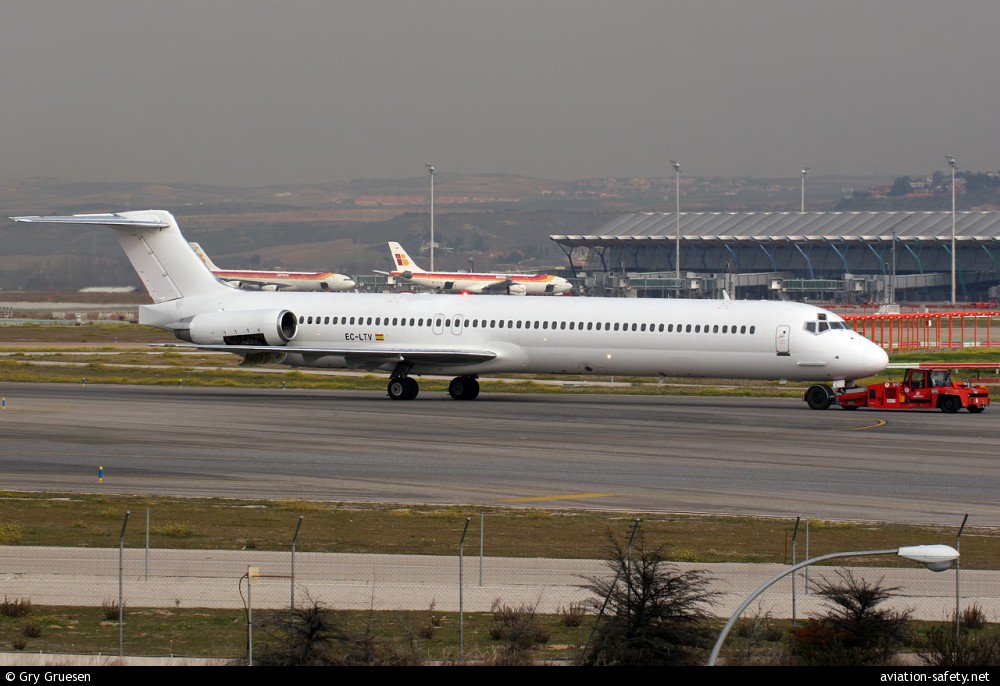
Air Algérie 5017
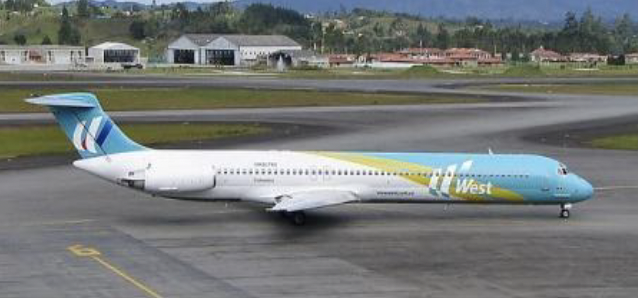
Air Algérie is the flag carrier of Algeria, owned by the Algerian government. In 2014, Air Algérie wet leased an MD-83 from Swiftair S.A., a Spanish Airline. Other than the registration number, the aircraft was all white and was well suited for the wet lease role.
Date: July 24, 2014
Time: 0147
Type: McDonnell Douglas DC-9-83 (MD-83)
Operator: Swiftair S.A. flying on behalf of Air Algérie
Registration: EC-LTV
Fatalities: 6 / 6 crew, 110 / 110 passengers
Aircraft Fate: Destroyed
Phase: En route
Airport (Departure): Ouagadougou Airport (DFFD)
Airport (Arrival): Algiers-Houari /Boumediene Airport (DAAG)
The pilots
The captain was a 47-year-old male with nearly 13,000 total hours, with over 10,000 in type, and over 6,400 as captain. The first officer was a 42-year-old female with just over 7,000 total hours, with over 6,000 in type.
The entire training records for the crew were examined during the investigation. There was no issue with their respective evaluations on their knowledge of the aircraft systems, flight management, CRM, skills and decision-making. During their training and recurrent checks, their professional level was judged by their instructors and examiners to be above standard.
Training in unusual attitudes, the approach stall and stall recovery was scheduled for the last half of the 2013-2014 recurrent training and checking cycle, i.e. during the simulation session in November 2014 (after the accident).
This means the captain and co-pilot had not been given training or checks on these items since they joined the airline.
Because it was impossible to access the archives of their former employer (Spanair no longer exists), it was not possible to know how far back their last training on these points took place.
Source: Final Report, pp. 99 - 100
The flight (to the region of reversed command)
Before takeoff the crew requested an initial cruise altitude of FL330 but later changed that to FL310 because they would be too heavy for the higher level. They took off at 0115Z, which was also the local time in Mali. The autothrottle was active from takeoff, the autopilot was engaged passing about 10,500 ft.
At 1 h 37 min 28, the aeroplane levelled off at FL 310 at Mach 0.740. The autopilot then maintained the aeroplane’s altitude and heading, while the speed was controlled by the autothrottle. . . . The Total Air Temperature was then -5°C.In the two minutes following level-off, the aeroplane’s speed increased.
From 1 h 38 min 34, and for about 30 seconds, the autothrottle was in MACH ATL mode. The engines’ EPR stabilised around 1.92 and the Mach changed from 0.758 to 0.762. The autothrottle then returned to MACH mode and the aeroplane continued to accelerate up to Mach 0.775.
[Source: Final Report, pp. 12 - 13]
The autothrottle selects more thrust in MACH ATL than in MACH mode. MACH ATL is used to accelerate to the desired Mach and MACH is used to maintain the desired Mach once achieved. At this point, all appeared normal. That, however, was about to change.
The temperatures encountered during the climb (from -16°C to -32°C) could be conducive to icing by supercooled water. However, analysis of the satellite imagery evolution did not indicate supercooled water was present. Additionally, the absence of significant turbulence on FDR data suggests that no updraughts that might have carried supercooled water were present on the aircraft flight path. The cell was in the "mature stage” when the aeroplane passed. The anvil cloud was then well developed and the updraughts in the cell core fed this anvil with ice crystals. Thus, the presence of ice crystals within the anvil cloud was very likely. These crystals could have spread under the anvil or be transported downwind from the cell, to the area that the aeroplane was flying in.
These elements led the investigation to consider icing caused by ice crystals more likely than icing caused by supercooled water. The concentration of ice crystals encountered is unknown.
[Source: Final Report, p. 42]
Investigators compared Flight Data Recorder (FDR) EPR values against calculated EPRs based on other engine parameters and concluded the value recorded by the FDR and actual EPR was about 0.34 on the left engine and 0.20 on the right engine. [Final Report, p. 68]
It appears the autothrottle reduced actual engine speed, and therefore actual thrust, to maintain the erroneous EPRs within limitations.
The presence of a storm cell close to the aeroplane's flight path, as well as the absence of activation of the engine anti-ice systems at the time the phenomenon occurred, makes more likely an obstruction of the Pt2 pressure sensors on the right engine, then on the left engine, resulting from icing.
[Source, Final Report, p. 69]
At 1 h 39 min 36, the aeroplane’s speed started to decrease. At 1 h 40 min 10, the autothrottle changed to MACH ATL and for about thirty seconds this mode alternated with MACH mode. At 1 h 40 min 46 the autothrottle changed back to MACH ATL mode while the Mach was 0.752. Following that and until 1 h 45, the altitude remained stable, pitch and EPR increased progressively, while the engines’ N1 remained stable and the speed continued to decrease.
[Source: Final Report, pp. 12 - 13]
What caused the flight into the region of reversed command
The thrust of the aircraft’s engines was determined by Engine Pressure Ratio (EPR), the pressure at the outlet (Pt7) divided by the pressure at the inlet (Pt2). The autothrottle normally uses EPR to set engine speed, though low compressor rotation speed (N1) can also be used. [Final Report, pp. 22-23]
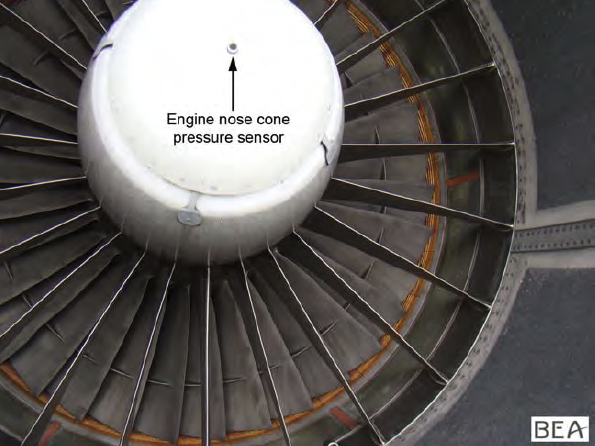
Nose cone, Final Report, fig. 3
Older jet engines, like this one, determine EPR by dividing the pressure at the outlet by the pressure at the inlet. Newer jet engines take the pressures from inside the engine, such as at a point along the compressor and turbines. In the case of this airplane’s Pratt & Whitney JT80 engines, the inlet pressure is measured directly from the nose cone of the engine. This can create a problem in the event of icing:
An obstruction of Pt2 sensor will result in a decrease of the measured pressure value and thus an increase in the EPR value. In this case, the aeroplane's systems use a measured EPR value greater than the true value of this parameter.
Source: Final Report, p. 25
Investigators believe the aircraft fell behind the power curve at time 0141:
Calculation of the thrust required made by the manufacturer also made it possible to determine the speed corresponding to flying behind the power curve. When the aircraft is flying behind the power curve its speed is unstable: starting with a situation where engine thrust equals the drag a reduction in the engine speed, under the influence of an external disturbance for example, results in an increase in the thrust required for stable level flight. Consequently if the thrust on both engines does not increase to reach the new thrust required the aeroplane continues to decelerate and the gap between the thrust applied and the thrust that would be required to return to the initial conditions increases.
The following graph shows that the flying behind the power curve occurs when Mach is about 0.72. The aeroplane reached this speed at 01 h 41 min 52, that is to say 2 min 17 after the appearance of the first engine EPR measurement error. Although the engines were capable of providing enough power to accelerate the aircraft, this was not actually commanded by the autothrottle due to erroneous EPR values.
Below about Mach 0.52, the maximum thrust that the engines could deliver was lower than the thrust required to maintain level flight at flight level 310. The only possibility was to descend.
[Source: Final Report, p. 74]

Thrust required and thrust available, Final Report, fig. 51
The flight’s conclusion
In the next five minutes, the autothrottle alternated between MACH ATL (thrust set to limit to achieve Mach) and MACH (thrust set to maintain Mach) modes, the pitch and EPR increased progressively while the engines’ N1 remained stable and the speed continued to decrease. At 0144, EPR and N1 indications fluctuated for 45 seconds. At that point, the EPR increased and decreased twice, from 1.6 to about 2.5. The N1s increased to 91% during the first oscillation and then remained between 83 and 87% during the second. The autothrottle was disengaged after the first oscillation. [Final Report, p. 13]
A minute later, at time 0145, the calibrated airspeed was 203 kt, the Mach was 0.561, the angle of attack was 9°, and the aircraft started to descend. Pitch increased as high as 10° and then decreased even as the elevators and horizontal stabilizer continued to pitch up. The EPRs and RPMs decreased to values corresponding to idle. [Final Report, p. 13]
At 1 h 45 min 35, the autopilot disengaged. The altitude had fallen by about 1,150 ft in relation to cruise flight level, the calibrated airspeed was 162 kt, the Mach 0.439, the angle of attack was 25° and both engines were almost at idle. The aeroplane’s pitch began to decrease and bank was increasing to the left.
The aeroplane’s pitch and bank was then subject to significant changes. They reached, respectively, 80° nose-down and 140° bank to the left. The aeroplane was pitched nose down and banked to the left until it struck the ground. The flight control surfaces remained mainly deflected pitch-up and in the direction of a bank to the right. Around twenty seconds before the impact, the flight control surfaces pitch-up deflection decreased, then the engine speed increased again and reached values close to maximum thrust.
Source: Final Report, pp. 13 - 14
The aircraft impacted the ground 58° nose down, in a10° left bank, at a calibrated airspeed of 384 kt. [Final Report, p. 15]

Final flight path [Final Report, fig. 2]
5
Avoiding life behind the power curve
(and what to do if you find yourself there)
It may be tempting to look at these three case studies and conclude it is a DC-9 / MD-80 problem, but recent history shows this isn’t true:
Airbus A330 (Air France Flight 447, 2009)
Boeing 777 (Asiana Flight 214, 2013)
CRJ-200 (Pinnacle Airlines Flight 3701, 2004)
DHC-8-400 (Colgan Air Flight 3407, 2009)
Avoiding life behind the power curve
Clearly the dangers of flying behind the power curve is an issue for all aircraft, especially those that fly at high altitudes. When it comes to keeping your aircraft flying, just as your very first flight instructor told you, speed is life.
1) When climbing with an autopilot that gives you a choice between “speed on pitch” (flight level change in other aircraft) or a mode that maintains a constant pitch, flight path vector, or constant vertical velocity, choose the mode that prioritizes airspeed. Some autopilots are better than others and in some conditions the speed on pitch mode will perform too roughly for passenger comfort. Vertical Speed (VS) mode is very dangerous and can result in a stall if you fail to adjust it as climb performance decreases. If your autopilot offers a Flight Path Angle (FPA) mode, that would be better than Vertical Speed (VS) mode. While you still run the risk of falling below your target speed, if you chose a modest Flight Path Angle you will have more time to react. If you must use a mode that will sacrifice speed, do not take your attention away from the airspeed indicator in the climb.
2) When maintaining altitude with an autopilot’s “altitude hold” mode, periodically check the pitch of the aircraft. You should know what is an acceptable pitch to maintain altitude and airspeed at high altitude. For many aircraft, this should be between 2 and 3 degrees nose up but you should know your aircraft’s value. If the pitch climbs just a few degrees above this, crosscheck airspeed immediately.
3) Understand that ice pellets can be found in clear conditions many miles downwind of convective activity. Consult your flight manual for best practices when it comes to engine and wing anti-ice; realize that your maximum performance altitude will decrease.
What to do if you find yourself behind the power curve
The lesson of the thrust versus velocity curve is that the only way to move from behind the power curve to ahead of the power curve is to lower your angle attack and do that aggressively. The longer you wait and the less aggressively you pitch down, the more the odds stack against you.
References
(Source material)
Aeronautical Information Publication, Aviación Civil Argentina, ENR-6.13 En-route Charts - En-route navigation chart - Contingency plan for the Republic of Argentina - Simplified ATS route network - INF https://ais.anac.gob.ar/.
DINACIA Uruguay, Informe Final de Accidente de Aviacion, McDonnell Douglas DC-9-32, Austral, Lineas Aereas Cielos Del Sur S.A., LV-WEG, Nuevo Berlin – R.O.U. – 10 Octubre de 1997.
Final Report, Accident on 24 July 2014 near Gossi (Mali) to the McDonnell Douglas DC-9-83 (MD-83) registered EC-LTV operated by Swiftair S.A., Commission D’Enquete Sur Les Accidents et Incidents D’Aviation Civile, 22 April 2016.
Hörnfeldt, Petter, Mentour Pilot, https://youtu.be/y__DBZUMJBg?si=Q0f7vwOd_1izxrA7.
Informe Final, West Caribbean Airways DC-9-82 (MD-82) Matrícula HK4374X, Machiques, Venezuela, 16 de Agosto de 2005, JIAAC Venezuela, JIAAC-9-058-2005.
Mentour Pilot, “HOW Was This Even ALLOWED? The Story of West Caribbean Airways Flight 708,” https://youtu.be/2-kjjtVqsXI?si=lYT0S1_QS_hjPdEQ.