The bottom line up top: It takes energy to flare and the only control of that energy you have is airspeed. (Assuming your gross weight, glide path angle, and environmental conditions have already been set.) We can measure the energy we have available if we have an Angle of Attack instrument, realizing that the difference between 1.0 normalized AOA and the AOA we have at any given moment can be used to maneuver the aircraft. Armed with this knowledge, we can improve our odds by adding airspeed, but not too much. (You still need to stop the airplane once you've landed.)
— James Albright
Updated:
2020-04-18
While we are on the topic of landing energy, we should also talk about windshear. One of the most valuable resources I've ever had in a cockpit was a Military Airlift Command flight engineer. Not only were they invaluable when it came to fixing things that were broken, they tended to be excellent cockpit procedure stewards. Their manual, AFM 51-9, is filled with techniques still applicable today, including what we in the Air Force used to call the Minimum Groundspeed Technique, something that is electronically considered in some Airbus aircraft and is worth understanding in any airplane.
A big thank you to Andreas Horn for the help with the engineering concepts here. Much of what I am presenting here is "above my engineering paygrade," and I relied on Adreas' help. If you are interested in this facet of aviation, you will be doing yourself a big favor by visiting his website: Engineering Pilot.
1
Energy to flare
How big is your margin over the stall in the flare (at VREF)?
How much surplus energy do you have when you approach the flare? I think one way to look at that is to examine the ratio of lift during the approach versus the maximum available lift.
Where:
L is the Lift produced
CL is the coefficient of lift
S is wing area
ρ is the density of the air
v is the velocity
More about this formula and its derivation: Lift.
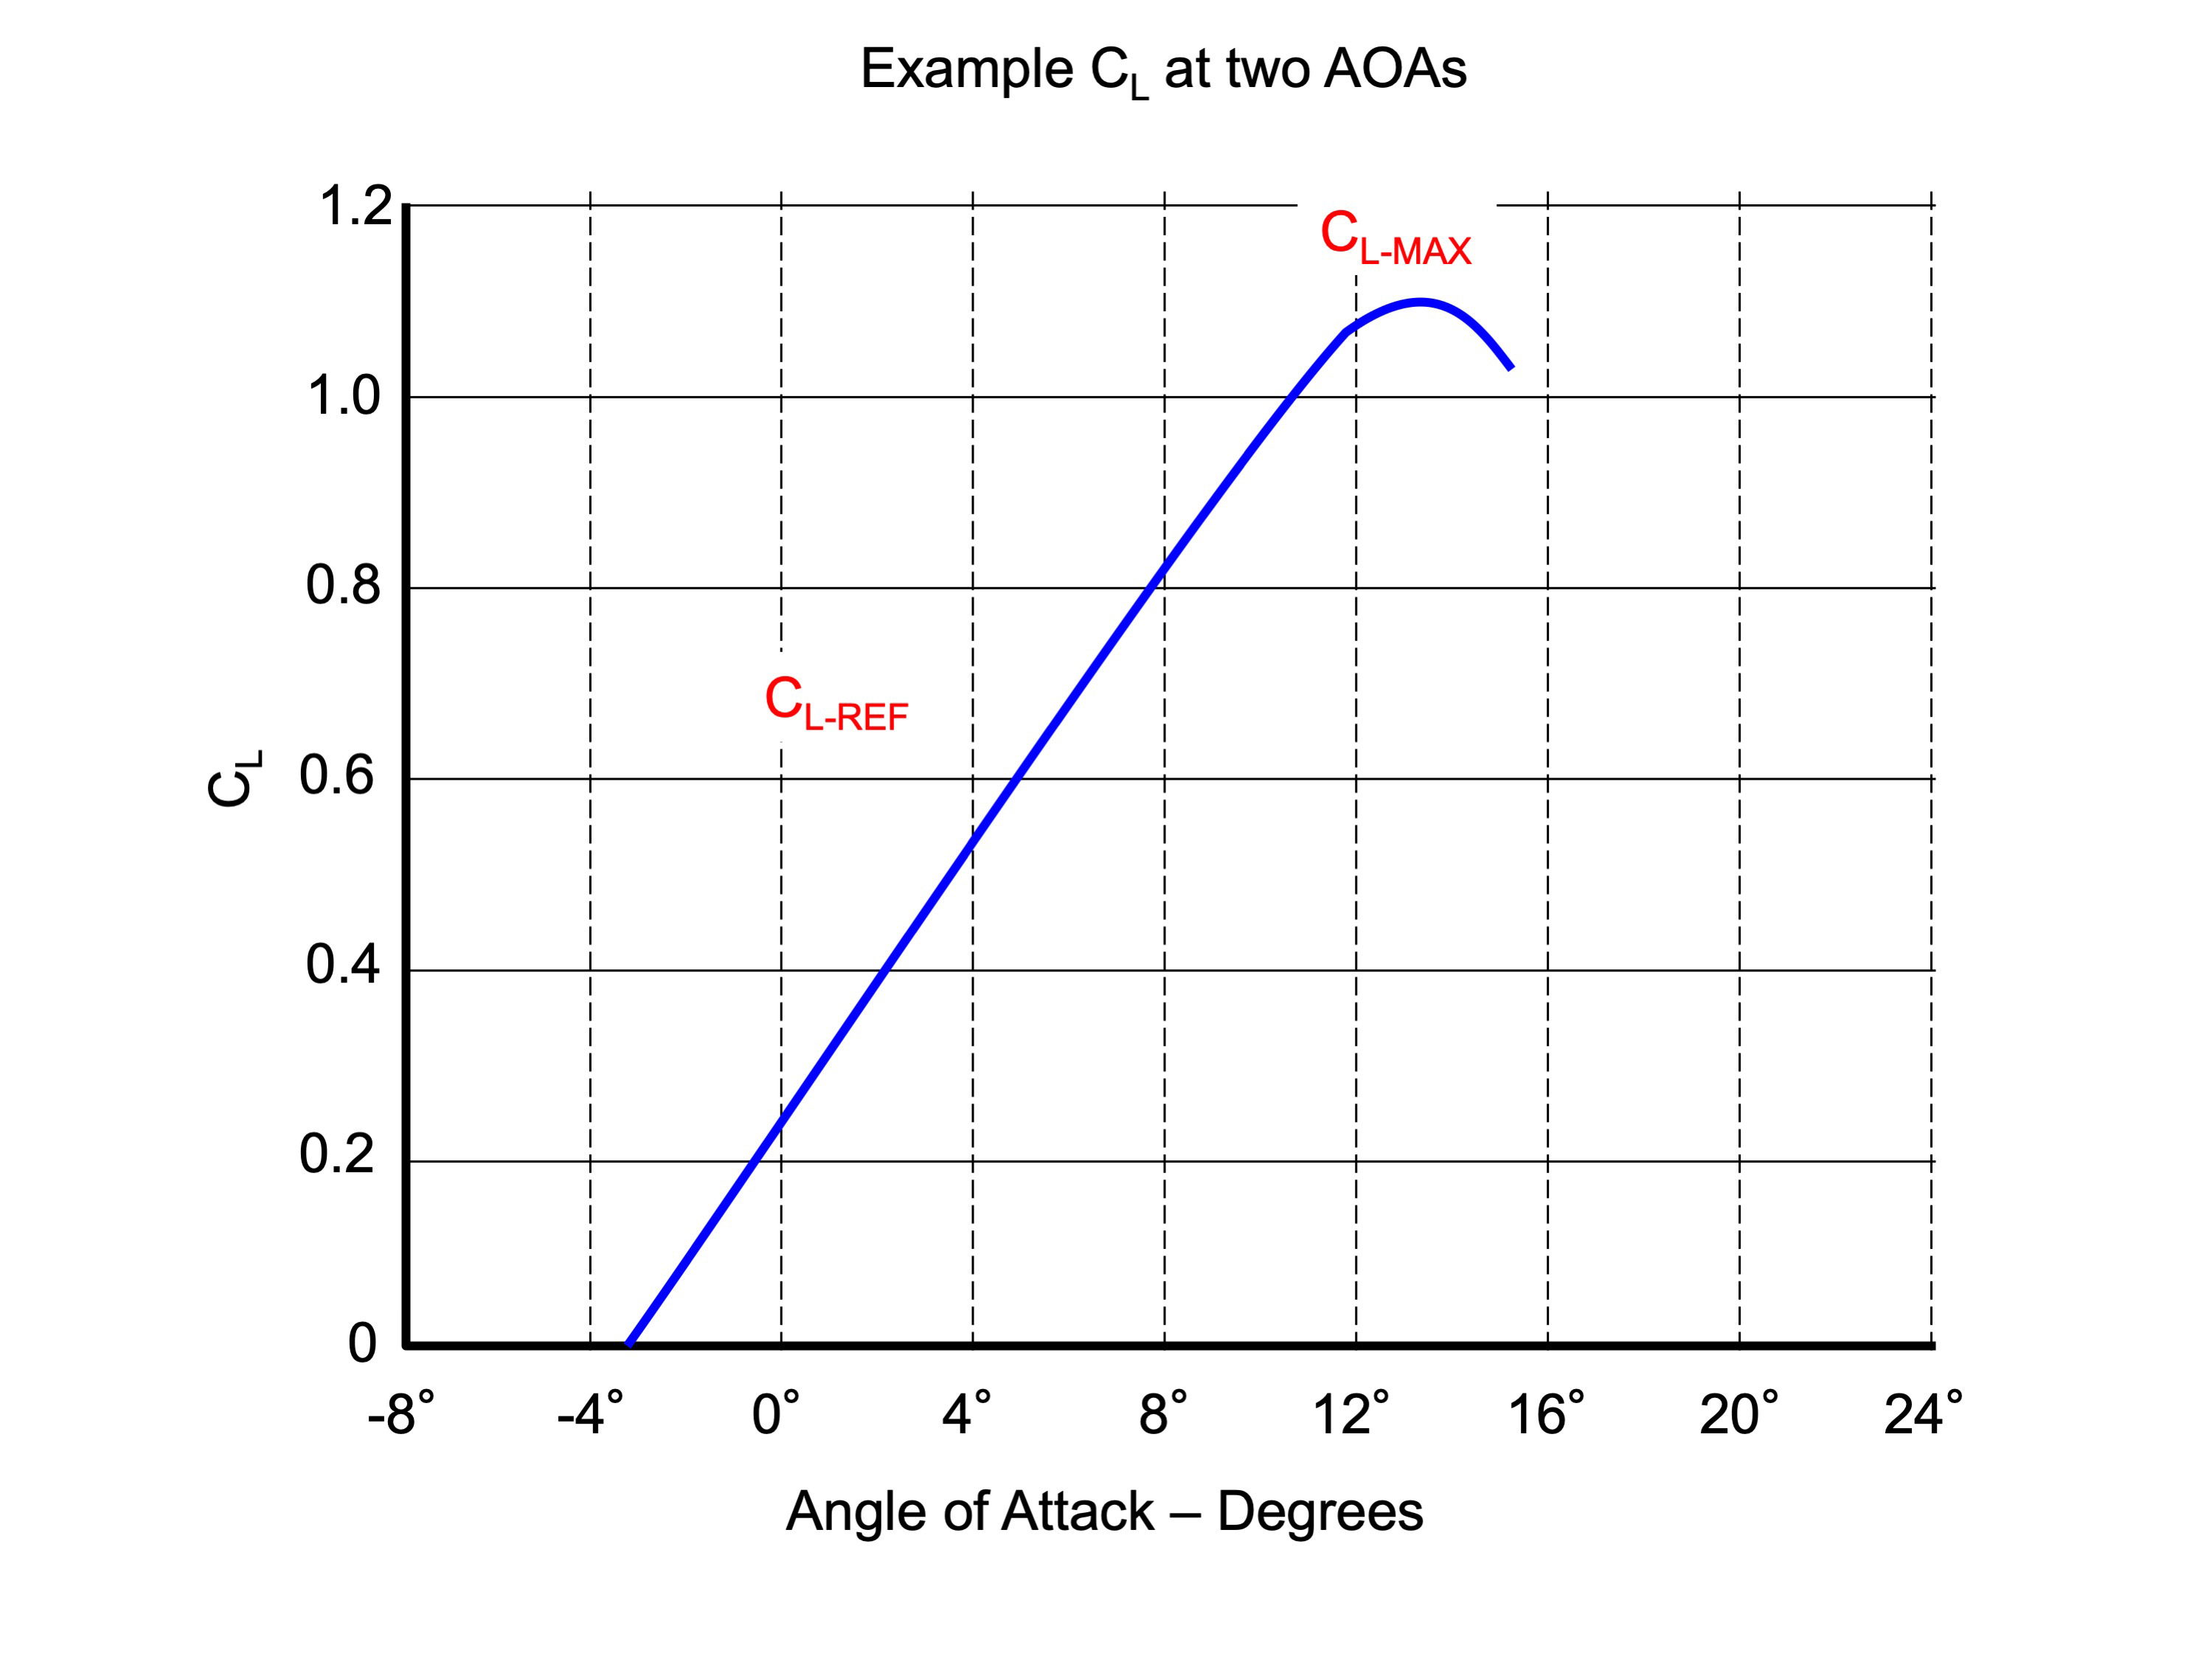
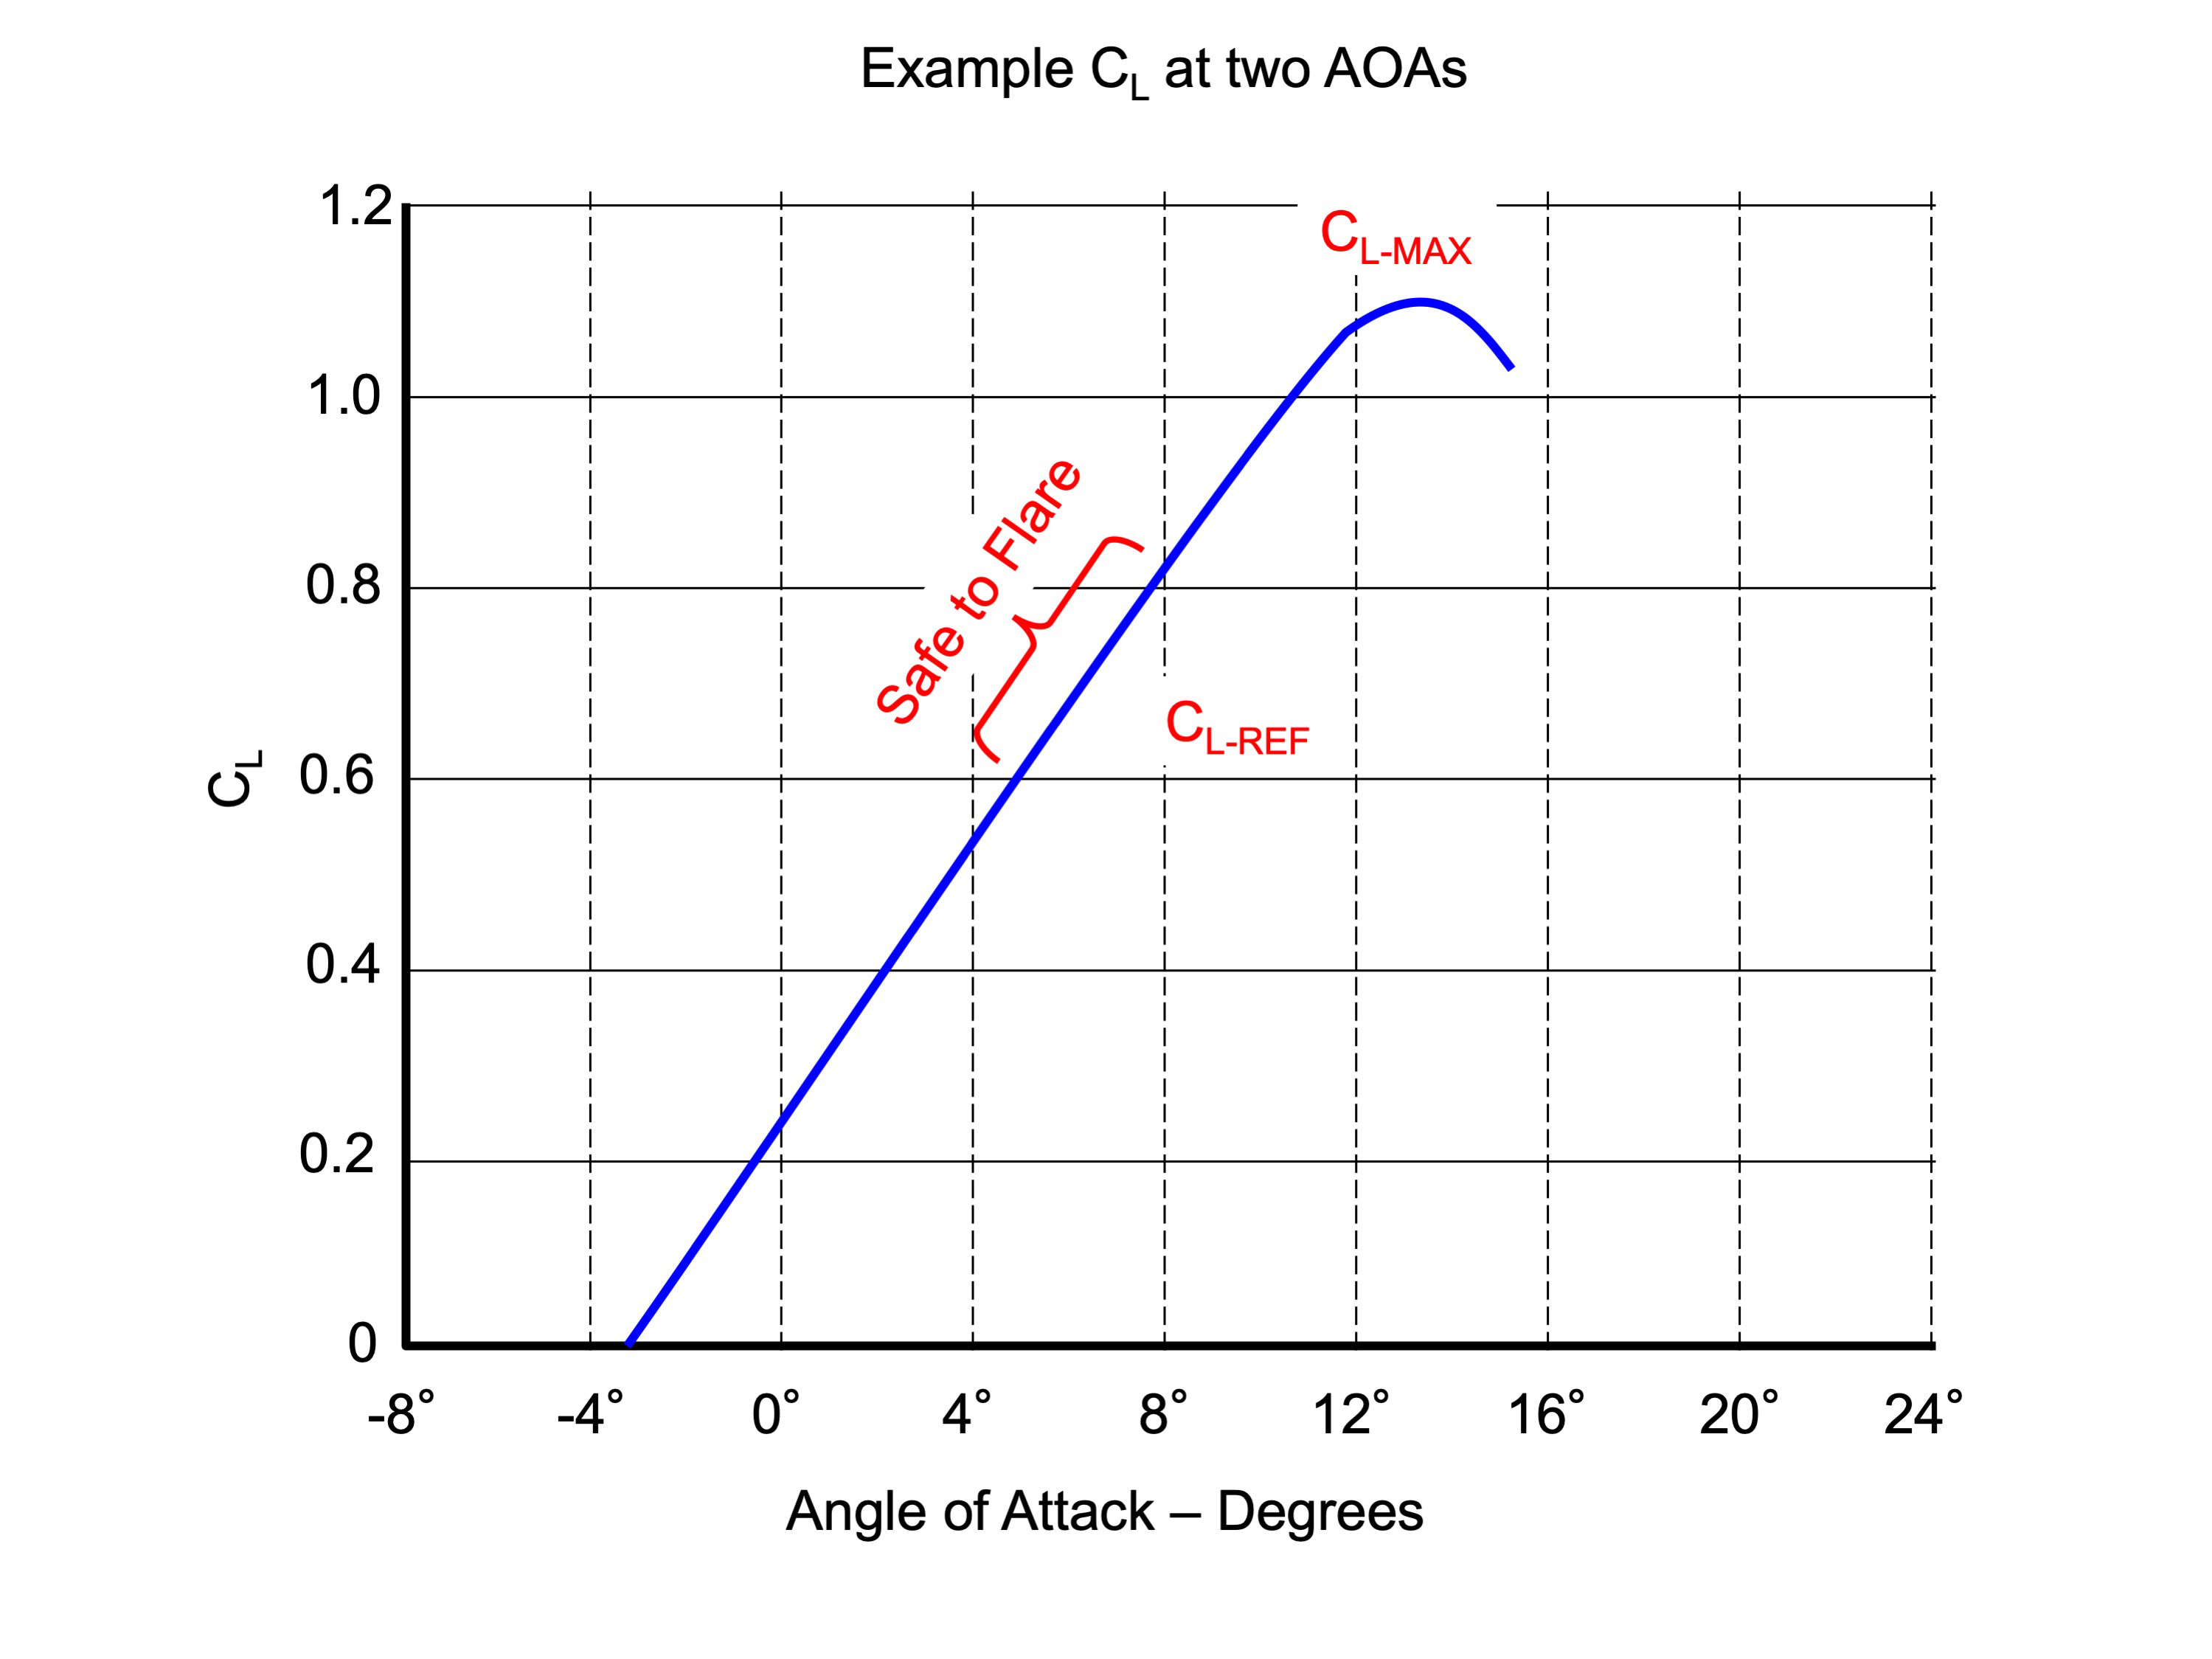
CL at two angles of attack, example aircraft
Given this, we can write two equations, one for Lift at reference speed and the second for Lift at the stall, or maximum lift:
Where:
LREF is the lift produced at VREF
LMAX is the lift produced at maximum lift
S is wing area
vS is the aircraft's stall speed in the landing configuration
CL-MAX is the coefficient of lift at maximum lift AOA
CL-REF is the coefficient of lift at the AOA at VREF
If we consider the same airplane in the same condition (on glide path at a steady speed), then LMAX = LREF:
Doing the math, we come up with the ratio of lift generated versus the lift available needed to maintain glide path without losing speed:
In other words, you have already used 60% of your margin. That means:
Notice that 0.6 is a typical Normalized Angle of Attack (NAOA) during approach for many aircraft. So it takes about 60% of the available lift to keep the airplane on glide path without losing airspeed. You have 40% left over to rotate the airplane into the flare. So that's how much energy you have by virtue of your airspeed. How much energy will it take to flare?
The Conservation of energy
There are several kinds of energy working on the aircraft descending on a glide path at a steady airspeed:
- Potential Energy (PE) — You can think of this as gravity and you can further simplify this as thinking of it as being a certain value when a number of feet above the runway, then zero on the runway.
- Chemical Energy (CE) — The engines are converting fuel into a lot of forward and perhaps a little upward thrust. The upward thrust could result from the angle of the engines versus the relative wind. The forward thrust also translates to upward thrust given the lift produced as a result of that forward thrust.
- Kinetic Energy (KE) — The kinetic energy is as a result of movement. The equation for Kinetic Energy is:
- Thermal Energy (TE) — This includes everything from the heat in the aircraft skin generated by the airplane cutting through the air, to the heat generated in the tires at touchdown and the wheel brakes as you press on the brake pedals.
Where:
m is mass
v is velocity

My tattoo
An engineering fundamental (some of us have this tattooed on our arms) is known as The Law of Conservation of Energy:
"The total energy of an isolated system remains constant, it is said to be conserved over time."
Another way to think of this is that energy cannot be created or destroyed, only converted:
Note that on glide path:
- PE ↓ — goes down as you lose altitude
- CE ↓ — goes down as you burn fuel
- KE ↔ — stays the same as you maintain forward IAS and vertical VVI
- TE ↔ — stays the same as the heat of the burned fuel and friction on the aircraft skin gets shed to the surrounding air.
How much "energy" does it take to flare?
If you ask a pilot who doesn't have a lot of experience landing heavy iron you will hear that the purpose of the flare is to go from that 650 ft/min to zero, giving you the kind of landing that garners applause from the paying seats. A pilot with considerable experience doing all this safely will tell you that you want to fly the airplane onto the runway, touching down still with some vertical speed. I've always used 100 ft/min as my desired touchdown velocity. This has several advantages:
- It avoids the "float" where a pilot looking for that soft touchdown or an unanticipated thermal or gust of wind leaves the airplane a thousand feet (or more) beyond the touchdown zone of the runway.
- It kills some of the energy with the heat of the touchdown, leaving less of the energy for the brakes to handle.
- It takes the guesswork out of having to estimate the altitude of the airplane during the flare.
- It is more consistent in application as well as results.
- A touchdown of 100 ft/min may not garner that applause, but it will be considered a good landing from the people who don't know any better (your passengers) and a safe landing from those that do (your fellow pilots).
We know intuitively that the issue here is we have something called momentum heading into the runway and we need to break that momentum. The formula for momentum is:
Where:
p = momentum
m = mass
v = velocity
We can isolate the momentum into vertical and horizontal components. Of course in our discussion of the flare we are interested in the vertical:
A change in momentum is known as "impulse" and it has a formula too:
Where:
J = impulse
F = force
Δt = time interval
By definition, impulse is the change in momentum:
For the purpose of examining the flare, we'll call F the force needed to flare. We also know that, thanks to Newton's Second Law of Motion:
Where:
F = force
m = mass
a = acceleration
Further, acceleration is the change in velocity, so a = (v1 - v2)/Δt
Of course we deal with weights, not mass. The formula for weight is:
Where:
W = weight
m = mass
g = gravity (9.8 m/s2)
Putting all this together:
Now let's consider the change in vertical velocity when going from 650 ft/min to 100 ft/min, that gives us:
That means:
Now bring the weight equation into play:
Simplifying:
We are ready for our example numbers. vvert-650 is 650 ft/min, that comes to about 3.25 m/sec. vvert-100 is 100 ft/min, that comes to about 0.5 m/sec. We'll say it takes 3 seconds to rotate from our glide path pitch to our flare pitch, so Δt = 3. Finally, the acceleration due to gravity, g, is 9.8 m/sec2.
From this we conclude we need to increase our Coefficient of Lift by 10 percent to cut our descent rate for the flare.
Staying ahead of the power curve
It is intuitively obvious to most pilots that there is a minimum acceptable speed to arrive at the flare. Not so intuitive, perhaps, is that there may be two possible thrust combinations for that particular speed. We need to think about keeping ahead of the power curve. But what does that mean?
You can't really measure thrust directly outside of a test stand because thrust changes with velocity and how would you measure it without something for it to push against? That's why jet engines tend to be rated in "static thrust," that is on a test stand, not moving. But you can measure drag and when an aircraft is in level, unaccelerated flight, drag equals thrust.
You can plot the thrust required to maintain level, unaccelerated flight versus airspeed and come up with a chart that will show you there is a speed where the thrust required is at a minimum, Point B on the chart shown. This is your maximum endurance speed.
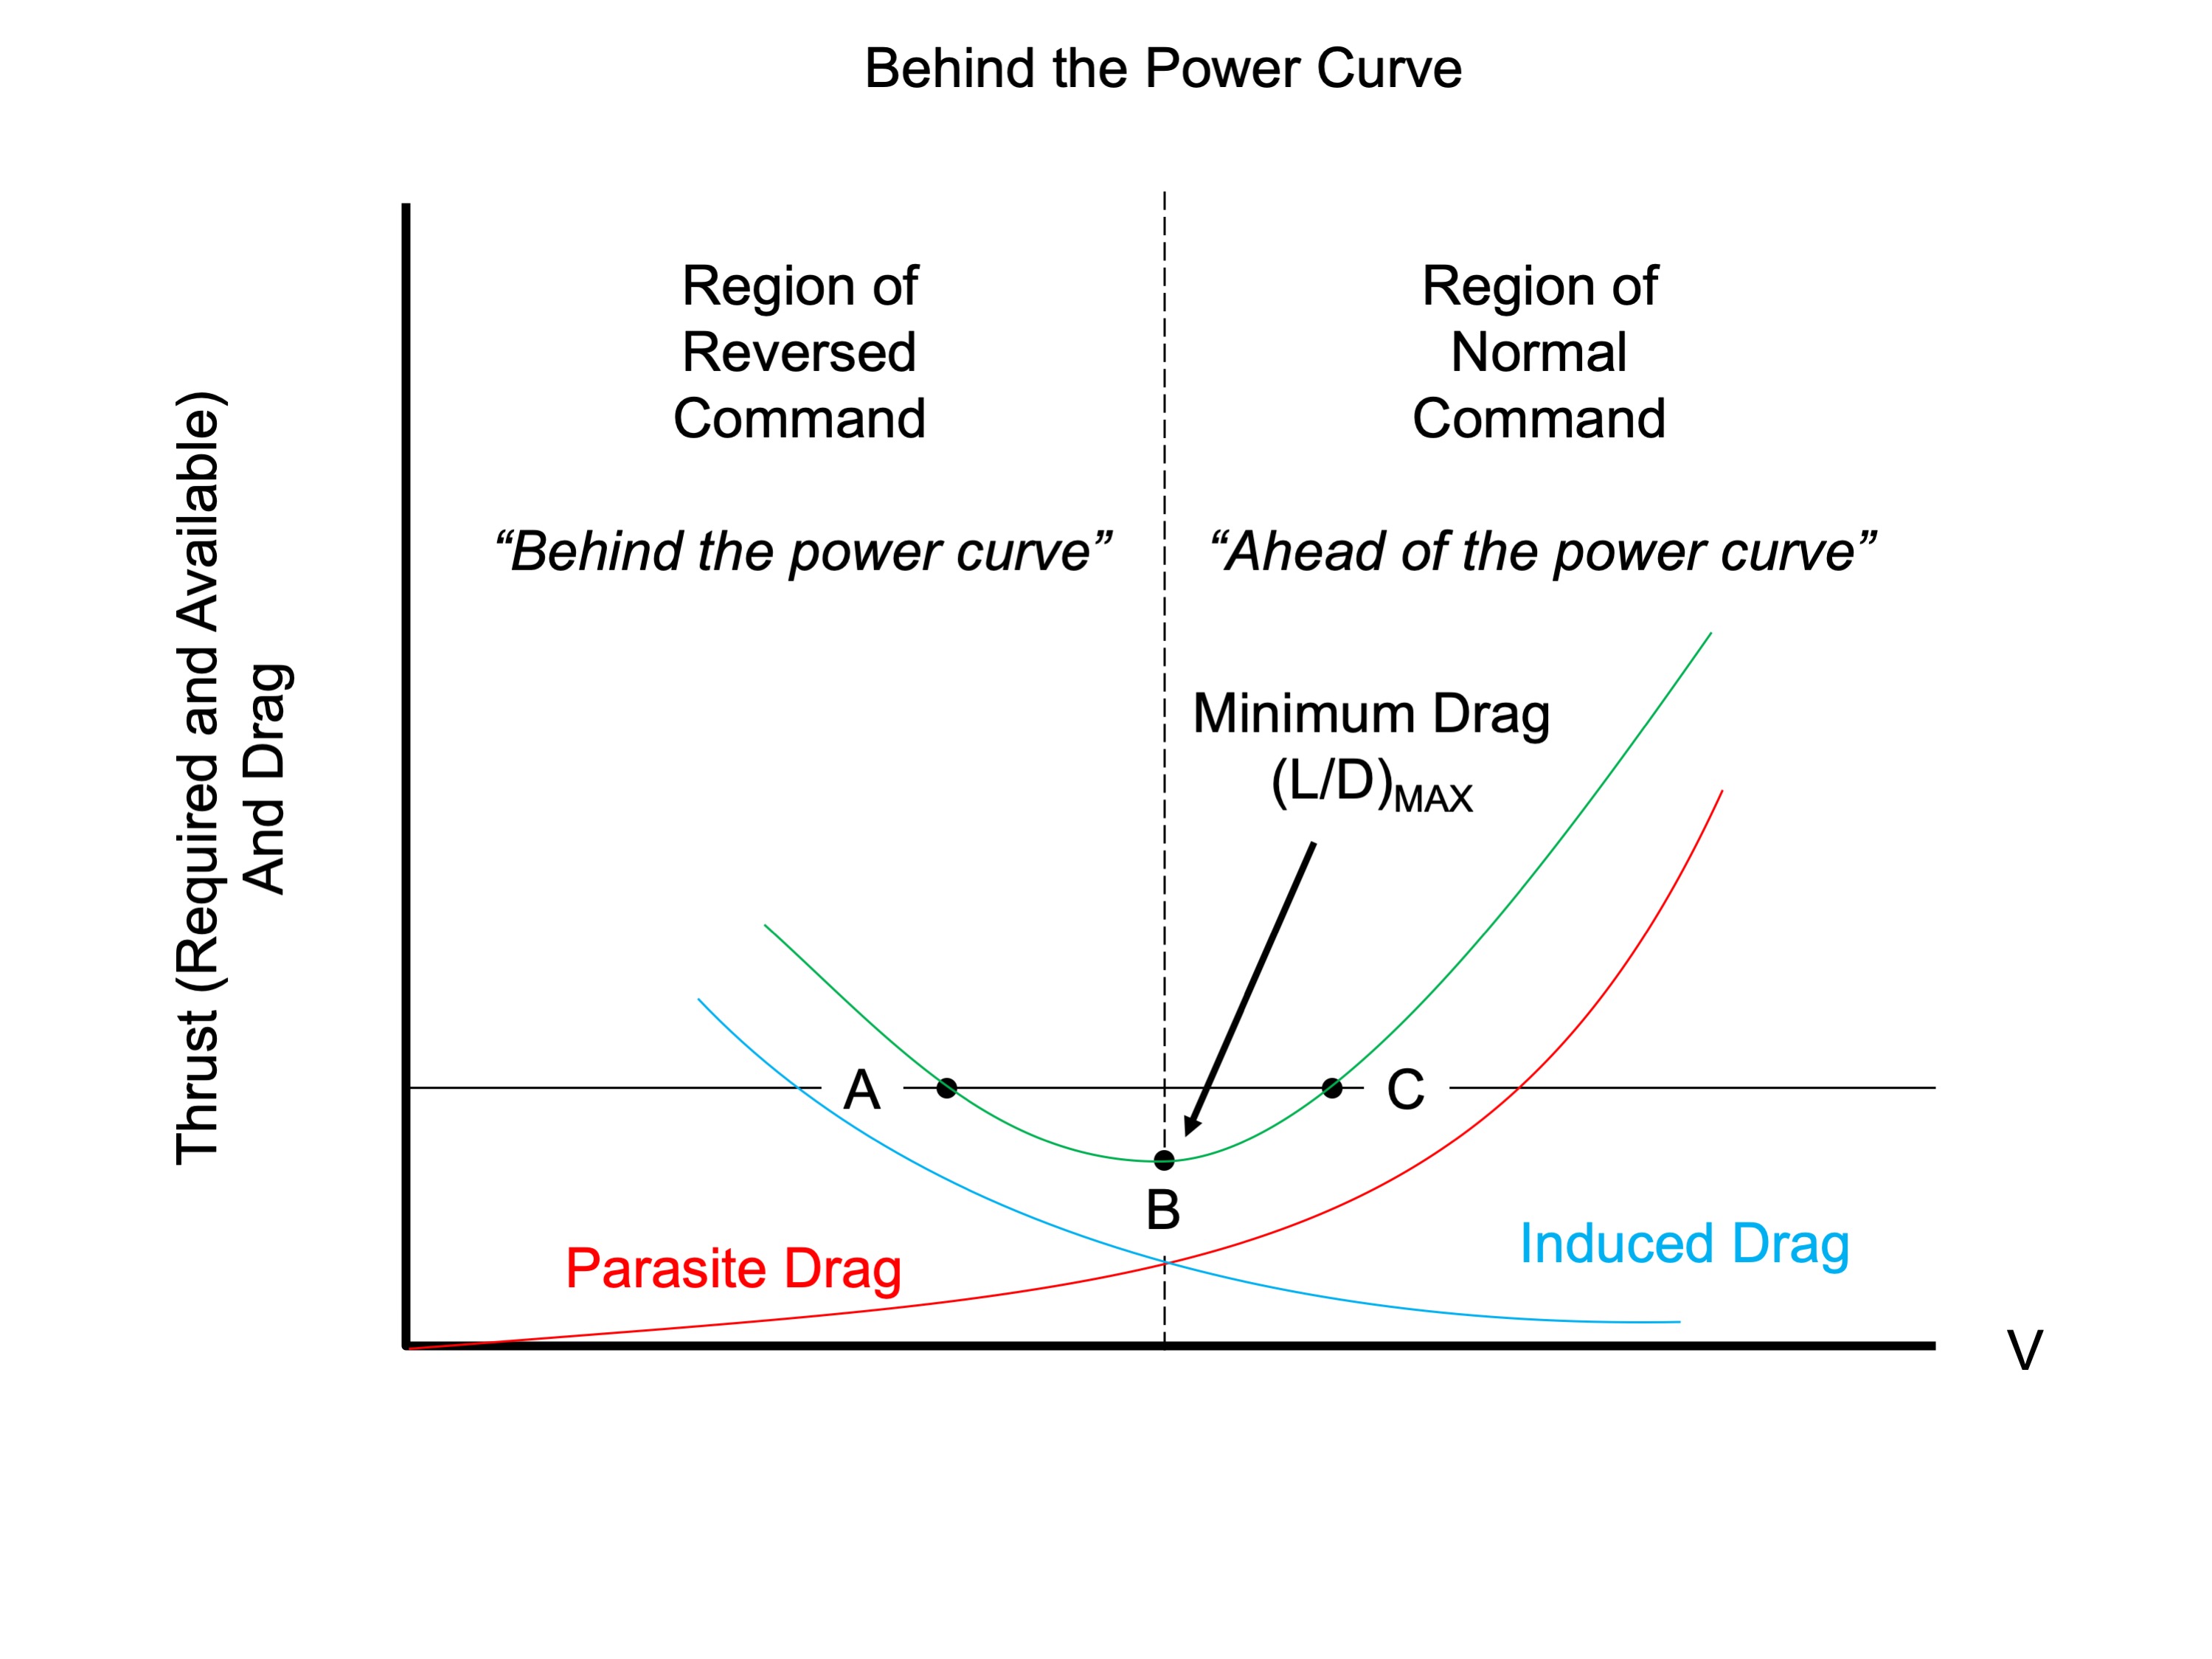
The "Power Curve"
At any speed above Maximum Endurance, you are in the region of normal command, where the relationship between your thrust levers and airspeed is as you would expect. At Point C on the chart, for example, pushing the thrust levers forward makes you go faster, pulling them back makes you go slower. Further, the new thrust required setting will be as you expect. Let's say you are at Point C and you want to add 5 knots. You push the thrust levers forward, you accelerate, and when you get to your target speed you retard the thrust levers, but end up at a new thrust setting which is higher than where you began. Perfectly normal, hence the name, the region of normal command. Another benefit on staying on the normal side of the power curve is it promotes airspeed stability. If a gust of wind or other environmental factor causes the aircraft to accelerate, it will be too fast for the thrust required and will tend to slow down. Conversely, if the disturbance causes the aircraft to decelerate, the thrust level will be too high for the existing airspeed and the airplane will tend to accelerate.
At any speed below Maximum Endurance, you are in the region of reversed command, where the relationship between your thrust levers and airspeed is unexpected. At Point A on the chart, for example, pulling back on the thrust levers will cause you to decelerate, as before, but to maintain the new speed you will need more thrust than where you began. The danger, of course, is you may not have enough thrust to maintain the new speed and the only way to accelerate will be to decrease the angle of attack.
Those engineering assumptions (what is a frictionless flare?)
Of course we have neglected a host of variables, such as idle thrust from the engines and the ground effect of the wings. Remember, also, that we have other "actors" in the energy equation:
But like our examination of the block and tackle pulley system, ignoring these smaller effects allows us to make decisions on the larger impacts. So here goes . . .
For most aircraft, CL-REF is around 0.6, on a scale from 0 to 1,0. We see that flare rotation to cut our descent rate from 650 ft/min to 100 ft/min requires an additional 10%. That takes us to 0.7, still leaving us a margin before the stall, but stall warning for many aircraft begin around 0.7.
So your flare rotation will "cost" you in terms of lift, but you know that because simply rotating the nose will result in a loss of airspeed. The amount of airspeed loss will be mitigated by the idle thrust (CE), but for most airplanes it is a losing battle. So the lesson here is that you don't have a large margin to fool with and the airplane will eventually end up on the ground with less than the needed airspeed to maintain flight. If you use up that margin while still several feet in the air, the result will be a landing not under your precise control.
2
Improving your odds
"Keeping straight"
We've seen that the flare moves us up the CL curve about ten percent and that we start around 0.6. The aerodynamic stall occurs around 1.0 and a typical stall barrier system starts to make itself known around 0.75 to 0.80. A truism among aeronautical engineers translated to pilot-speak may be "you need to keep on the straight part of the CL line." If our example aircraft has a VREF which is flown at an AOA of 0.60 and a stall warning system that activates at 0.85, we will want to keep our airspeed so as to maintain an AOA no higher than 0.75, since we know the flare will cost us 0.10.
CL at two angles of attack, example aircraft
Of course this is an example aircraft and yours may exhibit these characteristics at different angles of attack. But you cannot ignore the need to keep your AOA in a safe zone prior to initiating the flare. Getting too slow also risks venturing into the region of reversed command, and as we have already seen, we want to avoid getting behind the power curve. Airspeed, as your very first flight instructor told you, is key.
Adding to VREF
Of the variables in the equations covered so far, the only one you have real control over is the aircraft's velocity, v. Recall that we had 0.40 excess lift while starting the flare at VREF, but that alone wasn't enough to complete the flare. The aircraft manufacturer did the necessary tests to make sure the engines put out sufficient thrust (CE) to complete the flare but not so much thrust as to adversely impact your landing distance. But what if you encounter a gust of wind or other environmental factor that takes away some of your VREF. Now what? How will adding 5, 10, or 20 knots impact that margin?
As an example, let's look at an airplane in a configuration that gives it a stall speed of:
and a reference speed of:
And, as we proved earlier, this give you an excess lift factor of:
Adding 5 knots to our speed when starting the flare:
Adding 10 knots to our speed when starting the flare:
Adding 20 knots to our speed when starting the flare:
3
Minimum groundspeed technique
If you say, "In the event of a windshear, I will go around," you probably fall into one of the following camps:
- You are an instructor who normally only experiences windshear in a simulator,
- You are a novice pilot who has never really seen windshear, or
- You are an experienced pilot who believes the "I will go around" mantra but actually makes frequent exceptions.
If you aren't sure about that, how often have you flown into Teterboro to hear windshear had been reported as well as a gain and loss of 20 knots on final? In other words, a typical day at Teterboro. The point is that there are gusty winds within your capability that can be handled by adding to your approach speed. But there are also gusty winds that exceed that capability. More importantly, if that windshear happens to be a microburst, the go around could be the only thing that can save you. So with that as a caveat, here is a procedure still in use by some operators and even at least one manufacturer's FMS.
C-141, USAF photo
I learned the minimum ground speed technique for dealing with wind shear early on. "Gravity Always Wins". Our flight engineers could zero in on the aircraft's ground speed as if our lives depended on it. More about this: Windshear / Minimum Ground Speed.
The energy management concept is a proven procedure for coping with wind shear during final approach. It resulted from an intense analysis of adverse weather airflows, motivated by the loss of several aircraft, and made possible by current weather technology. As you may know, an aircraft's ability to maintain lift is dependent on aerodynamic flow, airspeed, and movement within an air mass. Jet streams, independent air mass movement, and airflow in and around thunderstorms provide an environment where an aircraft can almost instantaneously transition from one air mass to another. This is wind shear. The effect of wind shear is similar to the effect of wind gusts, except it can be much more severe. It can increase or decrease airspeed until engine thrust has no opportunity to reestablish the proper airspeed within the new air mass. Further, it can increase or decrease airspeed by the difference in velocity between the two air masses. At high speeds, the aircraft could exceed its maximum design airspeed limit, or at low speeds it could stall.
a. Let's assume that an aircraft is on final approach at a safe margin above stall speed. Further assume that we have a 50-knot headwind on this approach and that the aircraft is flying within this air mass at 125 knots indicated airspeed. If this aircraft transits a wind shear into another air mass that suddenly gives up the 50-knot headwind, the indicated airspeed instantly would drop from 125 knots to 75 knots and the aircraft will stall. In preparation for transiting this wind shear, we increase approach speed by the amount of the predicted loss. After penetrating the shear, airspeed will immediately reduce to the approach speed. We predict this airspeed loss by making a comparison between the reference groundspeed and the actual approach groundspeed. We compute reference groundspeed by applying 100 percent of the reported runway winds to the approach true airspeed. We compute an approach groundspeed by applying 100 percent of the actual winds (at approach altitude) to the approach true airspeed. Any significant difference between these two groundspeeds is reason to expect a wind shear. For example: assume you have a 10-knot headwind on the runway and a 50 knot-headwind at approach altitude. Obviously, the headwind must decrease by 40 knots by the time the aircraft reaches the runway. This can happen gradually or in a matter of seconds. If the pilot maintains approach speed plus the groundspeed difference (40 knots in this case), transiting the wind shear will reduce airspeed by 40 knots to the desired approach speed.
Source: Air Force Manual 51-9, ¶11-5.
CAUTION: This is a valid technique for dealing with a shear caused by one air mass sitting atop another. It should not be employed when dealing with convective activity, especially a microburst, where the magnitude of the speed loss or gain can be unpredictable.
The first time I saw this technique was in the 1-C-141B-1 and it didn't last long there. The Air Force became concerned pilots would believe windshear can be beat and instead preached a "When in doubt, go around" philosophy. AFM 51-9 makes a rather clumsy attempt at explaining it, perhaps we can do better.
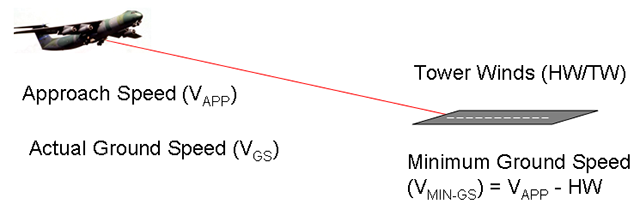
Minimum groundspeed technique
The technique:
- Convert tower winds to a headwind or tailwind component
- Determine aircraft approach speed (VAPP) for configuration crossing the runway threshold
- Compute Minimum Ground Speed (VMIN-GS) by subtracting the headwind from the approach speed or adding the tailwind
- Once the airplane is in approach configuration, monitor actual ground speed
- If actual ground speed goes below VMIN-GS, add the difference to your target approach speed
- If actual ground speed goes above VMIN-GS, be aware of a possible loss of wind which will cause a sudden sink rate, or if the wind continues a long landing
CAUTION: This is a valid technique for dealing with a shear caused by one air mass sitting atop another. It should not be employed when dealing with convective activity, especially a microburst, where the magnitude of the speed loss or gain can be unpredictable.
References
(Source material)
Air Force Manual (AFM) 51-9, Aircraft Performance, 7 September 1990