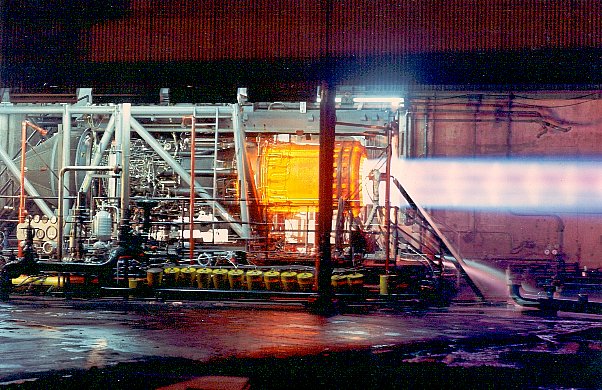
In aerodynamics we worry about thrust production because it is the key ingredient in aircraft performance. While you can measure jet engine thrust on a test stand, as shown here with the J-58 engine from an SR-71, cockpit measures such as EPR are used more for relative measures. "Push forward, go faster," etc.
— James Albright

Updated:
2014-04-07
We will dive into the subject of thrust with an eye toward understanding aircraft performance at various speeds and how to extract maximum range or endurance from your craft.
Before we begin, let me acknowledge that turbo fan performance is different than of a straight turbo jet. When considering the turbo fan I've made a few assumptions just to make it easy. Much of the theory is taken from the USAF T-38A aircraft with J85-GE-5 engines. Their theory of operation is probably the best documented of any aircraft I've ever flown and I think we can extract a lot of practical advice from them.
Oh yes, most of this comes from my notes from freshman aero at Purdue and USAF Undergraduate Pilot Training, but I did lean heavily on the references listed at the bottom of the page.
10 — Weight effect on maximum range
1
Considering the turbo fan
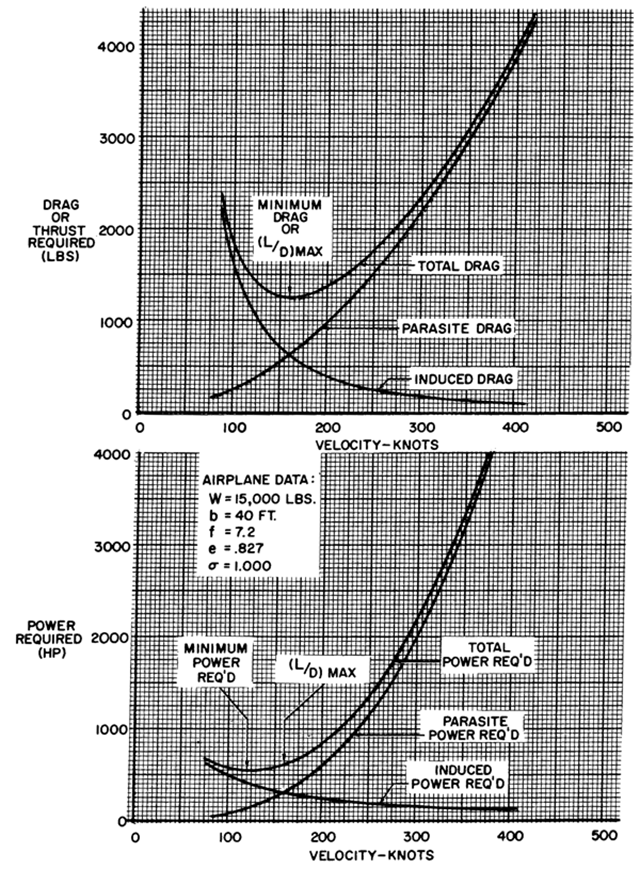
Airplane Thrust and Power Required, from [Hurt, pg. 98]
First two definitions:
Thrust-producing aircraft. Some aircraft produce thrust directly from the engines. Turbojet, ramjet, and rocket-driven aircraft are examples of thrust producers.
Source: Dole, pg. 68
Power-producing aircraft. All aircraft must produce thrust to overcome the drag of the aircraft. In aircraft that have propellers (or rotors), the engine does not produce thrust directly, These aircraft are called power-producers because power turns the propeller. The propeller, in turn, develops an aerodynamic force when it is turned through the air; this force is thrust.
Source: Dole, pg. 94
We will get into the derivation of the thrust required chart very soon, but before we do consider the charts here. The "Drag or Thrust Required" chart is for a turbo jet aircraft. Notice it has steep sides at both ends, it takes a lot of thrust to fly slow or fast in level flight. Now look at the "Power Required (HP)" chart. It too has a steep end for high speed flight but not so steep for slow speed flight. So the difference between the two is meaningful to the pilot.
So where does the turbo-fan engine lie? Somewhere in between, to be sure, but where? The G450 Powerplant Rolls-Royce Tay-611-8C engine, for example, has a bypass ratio of 3.1 to 1, which means about three-quarters of the air drawn in by the fan bypasses the engine completely and the jet itself only uses about a quarter. Does that mean the engine is 25% thrust and 75% power? I don't think so and most textbooks are silent on the subject.
For the purpose of the discussion which follows, I will assume the turbo fan behaves purely as a thrust-producing aircraft. It makes the discussion easier and if I am wrong, it only impacts the region of reverse command.
2
Principles of propulsion
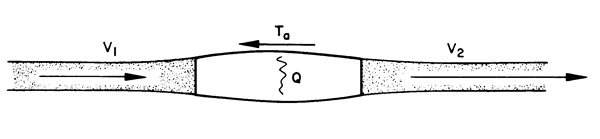
Principles of Propulsion, from ATCM 51-3, pg. 105.
You can summarize how a jet engine works with two principles brought to you by Sir Isaac Newton.
Newton's Second Law of Motion can be written as:
A force F acting on a mass a will cause the mass to accelerate in the direction of the force. The mass is the air passing through the jet engine.
Newton's Third Law of Motion states that for every action force there is an equal and opposite reaction force. The action force are the air particles accelerating aft, the reaction force is on the engine itself, accelerating forward.
We can derive an equation for thrust in a jet engine with a little mathematical slight of hand, manipulating proven equations to get the units to come out to force, which can be measured in lbs.
We know from our discussions about mass that the units of mass are lb-sec2/ft in the English system, also known as a slug.
We know from the Continuity Equation that:
Since a slug = lb-sec2 / ft, dividing that by a sec results in lb-sec / ft. Multiplying that by velocity in ft/sec cancels out the ft and the sec, resulting in lbs. In other words, multiplying mass airflow by the velocity change of that airflow gives you thrust: (Equation from Dole, pg. 70.
where:
T = Thrust (lbs)
Q = mass airflow = ρAV (slugs/sec)
V1 = Inlet (flight) velocity (fps)
V2 = Exit velocity (fps)
From this equation we can see that thrust can be boosted by either increasing the mass of the airflow sent through the engine or the difference in the exit and inlet velocity of that airflow. While ramping up the exit velocity would seem to be a great solution, it would mean turning jet fuel into kinetic energy that would be lost to the atmosphere as soon as it exits the tail pipe. The most efficient jet engine, in fact, would have an exit velocity nearly equal to the inlet velocity, but a very high quantity of air moved. Boosting the m is more efficient than boosting the (V2 - V1). Hence the trend towards bigger and bigger inlet fans on jet engines.
3
Thrust required curve
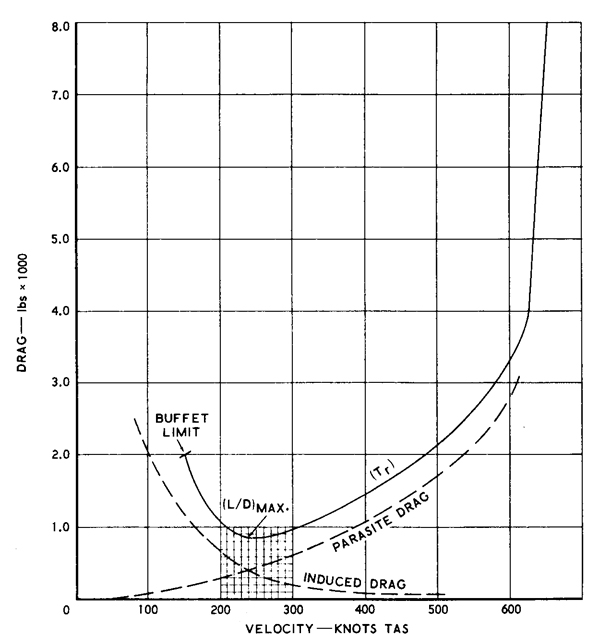
T-38 Drag Curve, from [Dole, pg. 68].
Measuring thrust from a jet engine in flight is extraordinarily hard to do. They are typically mounted to a test stand and restrained from moving and connected to a force gauge. The result is static thrust. Fortunately it is far easier to measure drag in a wind tunnel.
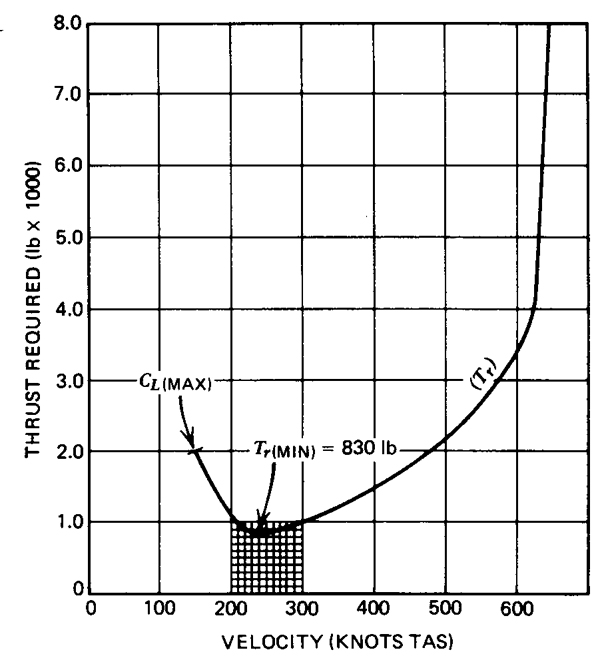
T-38 Thrust-Required, from [Dole, pg. 69].
As can be seen from the two graphs, the charts are equal for level, unaccelerated flight. The thrust = drag, after all.
4
Thrust available curve
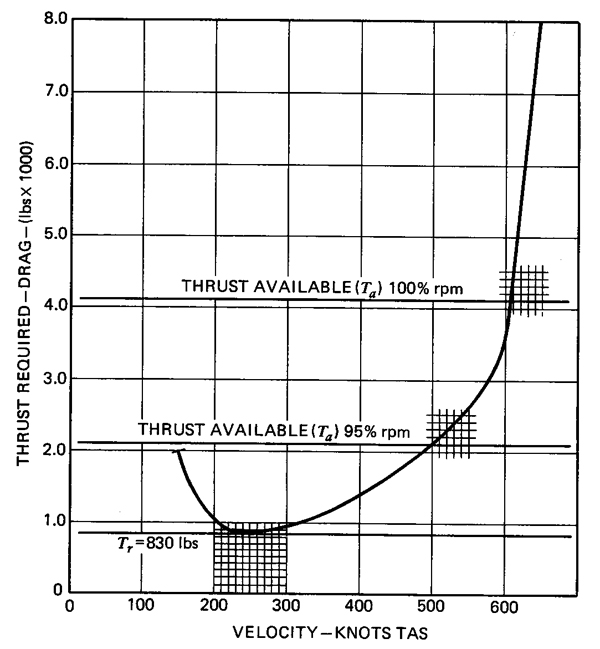
T-38 Thrust-Available / Thrust-Required, from Dole, pg. 75
If you add the thrust available to the thrust required chart, you can extrapolate some performance. The sea level chart shown, for example, shows where the T-38's top speed is versus two power settings.
5
Altitude effect
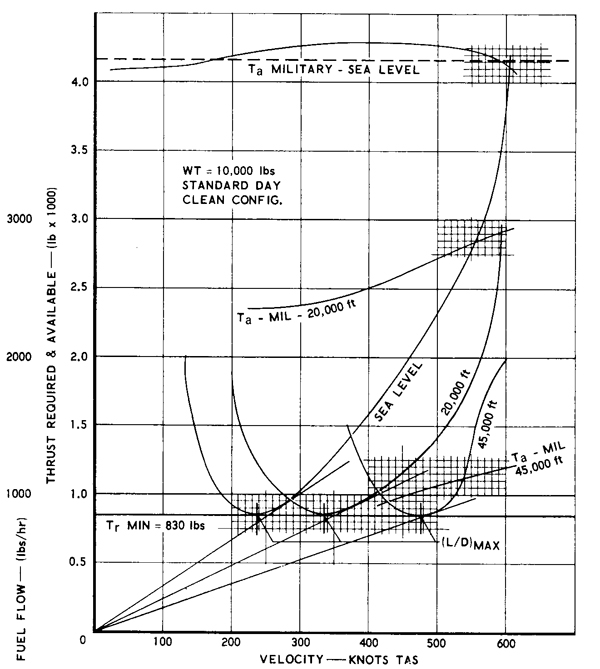
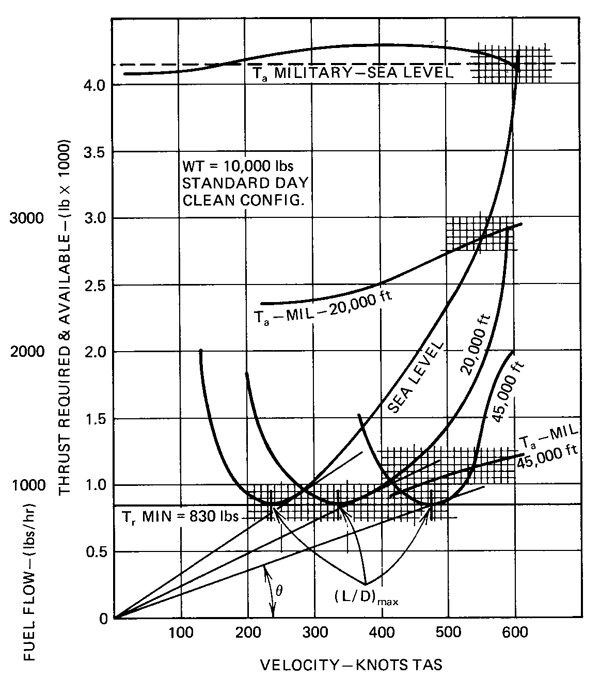
Altitude Effect on T-38 Thrust-Available / Thrust-Required, from Dole, pg. 80
While it is obvious that thrust available will decrease with altitude the impact on thrust required is less clear cut. We know the drag curve will be equal to the thrust required curve for unaccelerated flight. The equation for drag, we've already seen, is:
Since the wing area doesn't change, the only variables are the CD drag coefficient and the dynamic pressure q. Without the use of high lift or other wing altering devices, CD only changes with AOA. The dynamic pressure changes with airspeed. So does that mean drag is constant with changing altitudes? Yes, if flying at the same equivalent airspeed. That is hard to do as you climb. Most aircraft cannot fly the same speed range at high altitudes as they can at sea level.
6
Weight effect
T-38 Weight Effect on Thrust-Required, from Dole, pg. 77
Changing the weight of the aircraft has a big impact on induced drag since the lift component of the aerodynamic force must compensate and the thrust required must increase to do this. The parasite drag hardly changes at all. As we saw in the Drag Curve, induced drag is greatest a low speeds while parasite drag is greater at high speeds.
The net effect is that an increase in weight tends to shift the thrust required curve up and to the right. This makes intuitive sense: an increase in weight narrows your speed range and increases your minimum speed, while at the same time requiring more thrust.
7
Configuration effect
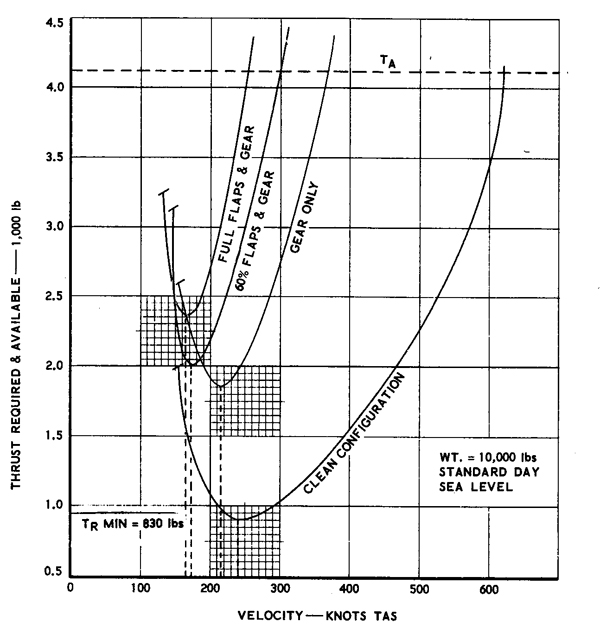
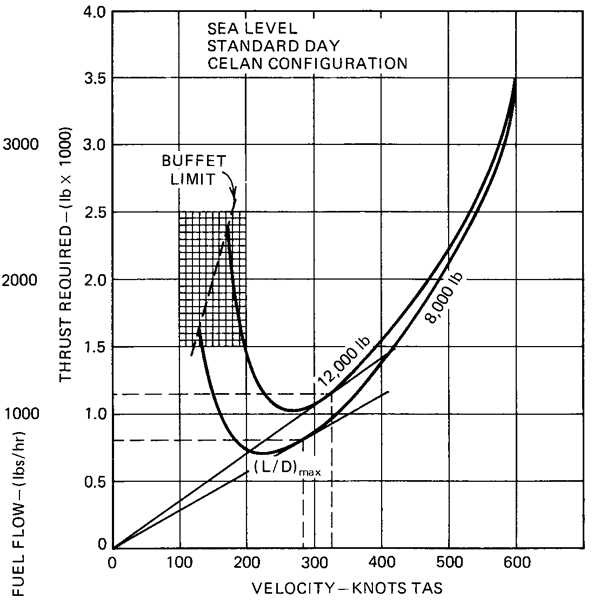
T-38 Configuration Effect on Thrust-Required, from Dole, pg. 79
A configuration change is in many ways the opposite of a weight change. Lowering the landing gear or extending the flaps greatly increases parasite drag while having a relatively smaller impact on induced drag. As a result, the thrust required curve is moved up and to the left.
8
L/DMAX
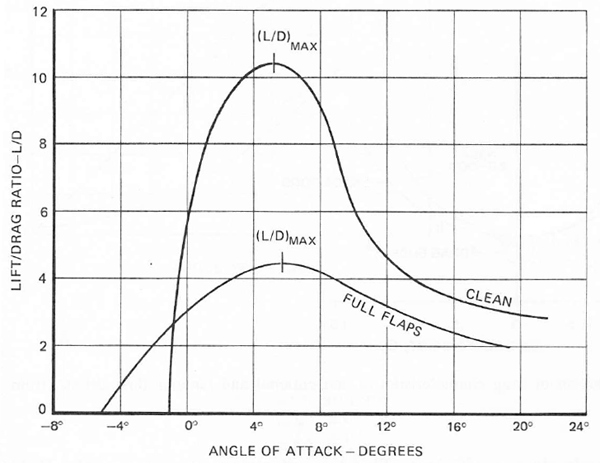
Typical Lift to Drag Ratios, from Dole, pg. 48
Dividing an aircraft's CL by CD yields a measure of its efficiency known as the L/D ratio. Where this curve peaks is known as L/DMAX and occurs at the airplane's most efficient angle of attack.
You can reason from the chart that this point occurs where total drag is at a minimum which means excess thrust is at a maximum. Since thrust produces the aerodynamic force that resolves into lift, we can also reason lift will be at a maximum here.
It is critically important to note that L/DMAX occurs at a certain angle of attack that does not change with weight.
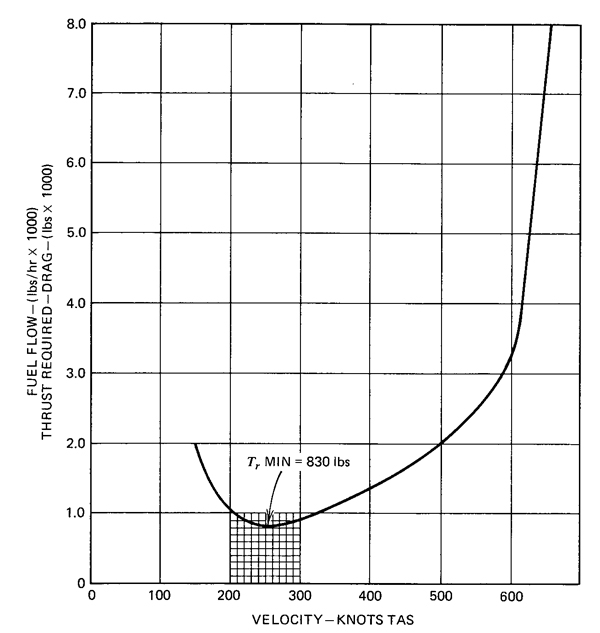
T-38 L/DMAX, from Dole, pg. 87
Looking at an aircraft's thrust required chart, we see the same point, but this time at the nadir of the curve.
Four items of note happen at the L/DMAX AOA:
- Minimum drag.
- Maximum engine-out glide range.
- Maximum climb angle.
- Maximum endurance.
While the first three items should be obvious, the third deserves further discussion. L/DMAX requires the lowest fuel flow so the aircraft will be able to remain aloft for the most time, without regard to the distance covered.
9
Maximum range
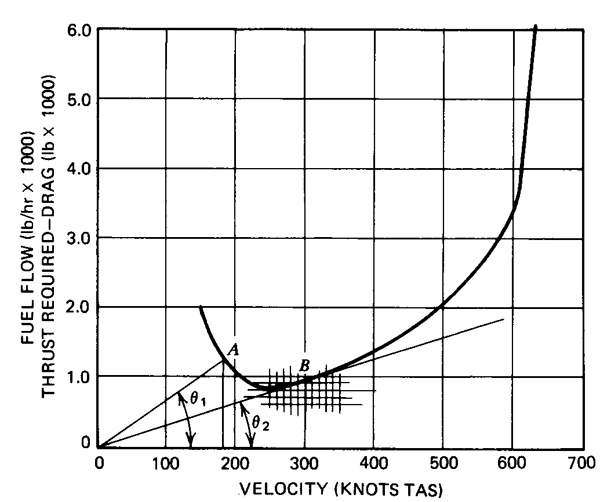
T-38 Maximum Range, from Dole, pg. 88
Finding the airspeed that will result in maximum range involves a little trigonometry:
Using the unites on the chart shown,
Dividing both sides of the fraction by time:
Removing the units:
RangeMAX occurs at (Fuel Flow / V)MIN
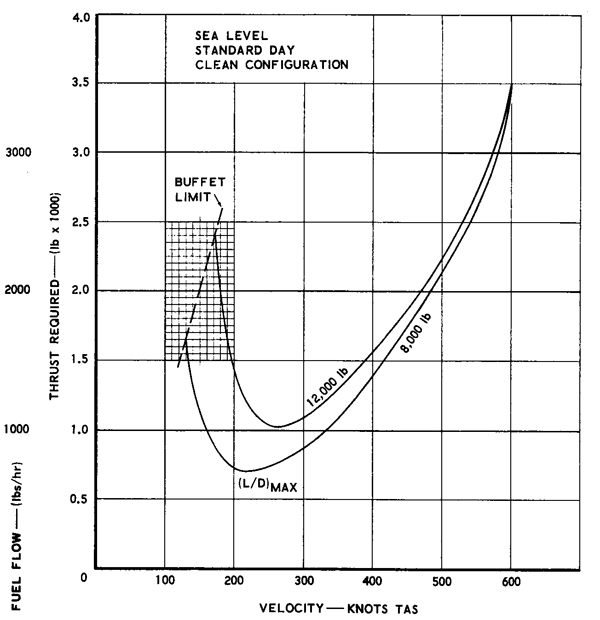
Ratios of fuel flow to velocity form a triangle on the thrust required chart, as shown by θ1 and θ2. The Fuel Flow / V ratio is minimized when the tangent of θ is minimized. That point can be found by graphically drawing a line from the origin to the thrust required curve. The intersection is where maximum range is achieved. In the example chart, this is a Point B, around 300 knots.
10
Weight effect on maximum range
T-38 Weight Effect on Maximum Range, from Dole, pg. 89
As we have seen when considering Weight Effect on Thrust Required an increase in weight shifts the thrust required curve up and to the right. Of greater importance when discussing range, however, is what happens as weight is reduced. The curves switch down and to the left, which means airspeed must be reduced as fuel burns off to achieve maximum range.
11
Altitude effect on maximum range
T-38 Altitude Effect on Range, from Dole, pg. 91
In the case of the T-38, increasing altitude up to the aircraft's service ceiling of 45,000' increases range by operating the engines at a lower temperature up through the tropopause, and increasing engine RPM to more efficient ranges. This is probably true for most aircraft.
12
Wind effect on maximum range
Theory
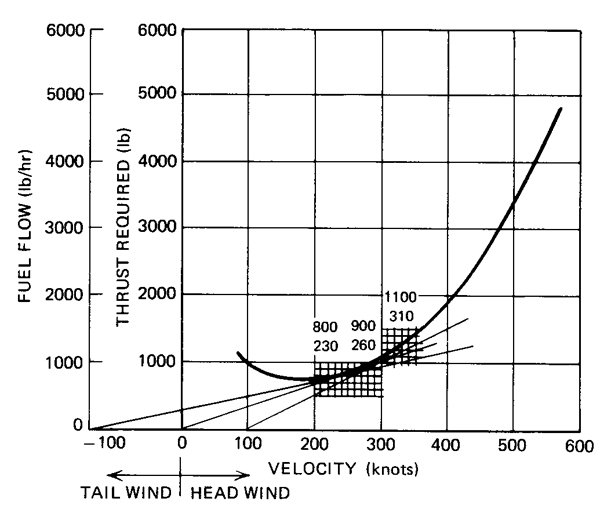
T-38 Wind Effect on Range, from Dole, pg. 91
The following might be true for the T-38: Dole, pg. 90. "An aircraft flying into a head wind is in an unfavorable environment and thus should fly at a higher true airspeed to lessen the effect of the head wind. Likewise, an aircraft flying with a tail wind is being helped on its way and thus should slow down to take advantage of the wind."
The accompanying chart for the T-38 seems to bear this out, adjusting the velocity with the wind does seem to indicate a different tangent to the thrust required line. As we saw above, the line drawn from the origin to the curve indicates the velocity where range is maximized. The theory, then, is you can adjust the origin to account for wind.
Test of the Theory
Using the performance charts from 1T-38A-1, we can test this claim using a 10,000 lb aircraft flying at 25,000' and determine that MMaximum Range = 0.75. where TAS = 450 and fuel flow = 1700 lb/hr. With no wind, the range on 1,000 lbs of fuel comes to 450 (nm/hr) x (1000 lb) / (1700 lb/hr) = 265 nm.
If hit with a 40 knot headwind, range decreases to (450 - 40) (nm/hr) x (1000 lb) / (1700 lb/hr) = 241 nm.
If the theory holds up, we will get better range on our 1,000 lbs of fuel if we speed up. Speeding up to M 0.80 we see TAS = 490 TAS and fuel flow = 2000 lb/hr. With that same headwind, our range is (490 - 40) (nm/hr) x (1000 lb) / 2000 lb/hr) = 225 nm. Less!
What about a tail wind? If hit with a 40 knot tailwind our M 0.75 performance becomes 450 + 40) (nm/hr) x (1000 lb) / (1700 lb/hr) = 288 nm.
According to the theory, we will get better range on our 1,000 lbs of fuel if we slow down. Slowing down to M 0.70 we see TAS = 4420 TAS and fuel flow = 1600 lb/hr. With that same headwind, our range is (420 + 40) (nm/hr) x (1000 lb) / 1600 lb/hr) = 287 nm. Close but still less!
While this is only one data point, it appears the claim is false for the T-38.
Note: the charts I used are available here.
Conclusion
I first read this claim in 1984, when I was flying the Boeing 707. I ran numbers on that aircraft and every aircraft I've flown since. It never pans out to be true. You are not better off speeding up in a headwind or slowing down in a tailwind. That might work for boats on the water and it might even work for some aircraft. But I venture to say that for most aircraft it does not.
References
(Source material)
14 CFR 25, Title 14: Aeronautics and Space, Federal Aviation Administration, Department of Transportation
Air Training Command Manual 51-3, Aerodynamics for Pilots, 15 November 1963
Connolly, Thomas F., Dommasch, Daniel 0., and Sheryby, Sydney S., Airplane Aerodynamics, Pitman Publishing Corporation, New York, NY, 1951.
Davies, D. P., Handling the Big Jets, Civil Aviation Authority, Kingsway, London, 1985.
Dole, Charles E., Flight Theory and Aerodynamics, 1981, John Wiley & Sons, Inc, New York, NY, 1981.
FAA-H-8083-15, Instrument Flying Handbook, U.S. Department of Transportation, Flight Standards Service, 2001.
Gulfstream G450 Airplane Flight Manual, Revision 35, April 18, 2013.
Gulfstream G450 Aircraft Operating Manual, Revision 35, April 30, 2013.
Hage, Robert E. and Perkins, Courtland D., Airplane Performance Stability and Control, John Wiley & Sons, Inc., 1949.
Hurt, H. H., Jr., Aerodynamics for Naval Aviators, Skyhorse Publishing, Inc., New York NY, 2012.
Technical Order 1T-38A-1, T-38A/B Flight Manual, USAF Series, 1 July 1978.
Please note: Gulfstream Aerospace Corporation has no affiliation or connection whatsoever with this website, and Gulfstream does not review, endorse, or approve any of the content included on the site. As a result, Gulfstream is not responsible or liable for your use of any materials or information obtained from this site.