In a day when almost every cockpit is filled with precise navigation equipment that measures tolerances in feet instead of miles, you can be forgiven for thinking nothing can go wrong. But professional aviators want to have a back up. When you fly domestically in most parts of the world, you have air traffic control's radar backing you up. What about when oceanic or remote? You become the backup and you do that by plotting.
— James Albright

Updated:
2021-10-03
We'll focus on the why and when questions here.
4 — Why the pilot is the last line of defense
In other articles, we'll cover:
How to Plot, Paperless Methods

1
Do you have to plot?
Legally speaking
This used to be a pretty ease case to make because It once said so, right here:
"The Rule," from an out of date version of FAA Order 8900.1, Vol 4, Ch 1, ¶4-80
That language also once appeared in AC 91-70, in the days before that advisory circular had any of the alphabet appended to it. Now here is what the FAA order says:
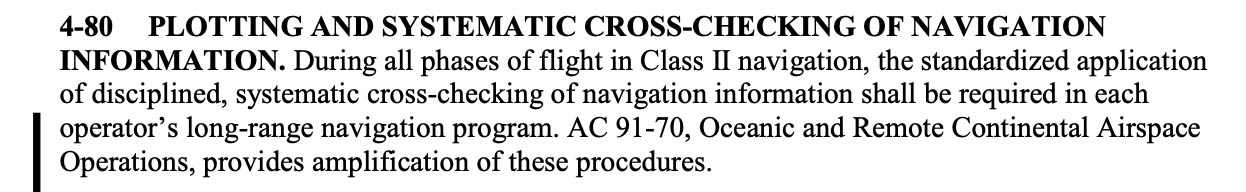
"The New Rule," from an out of date version of FAA Order 8900.1, Vol 4, Ch 1, ¶4-80
So now the requirement simply says "systematic cross-checking" in accordance with AC 91-70 and it doesn't tell you when that is required.
Practically speaking
If all you read was the current Oceanic and International Operations advisory circular, you would be led to believe plotting is optional:
Up to now the only recommended method of cross-checking aircraft position in the oceanic airspace environment was manual plotting on a chart. However, a panel of aviation industry and FAA personnel completed an Operational Safety Assessment of methods for cross-checking oceanic flight navigation. The panel determined that an alternative to manual plotting, by which aircraft position could be checked through use of aircraft FMS-driven navigation displays and indications, would provide for an equivalent level of safety.
Source: AC 91-70B, ¶6.4.8.2
Plotting your route on your chart will increase your situational awareness as you execute your trip through oceanic and remote continental airspace.
Source: AC 91-70B, ¶6.3.1.11.1
You should use a chart, of appropriate scale, to provide yourself with a visual presentation of your intended route, regardless of your type(s) of long-range navigation system (LRNS). Plotting your route on your chart will increase your situational awareness as you execute your trip through oceanic and remote continental airspace.
Source: AC 91-70B, ¶6.3.1.11.1
If you have to do a "table top" with the FAA — one where they are considering giving you the authorization to fly oceanic through LOAs B036 or B039 — they will ask you to plot, so you are going to have to know how.
2
Why should you plot?
In the old days — when we were entering latitude and longitude into an inertial navigation system that didn't understand named waypoints — the typical reason given for plotting was the one degree error.
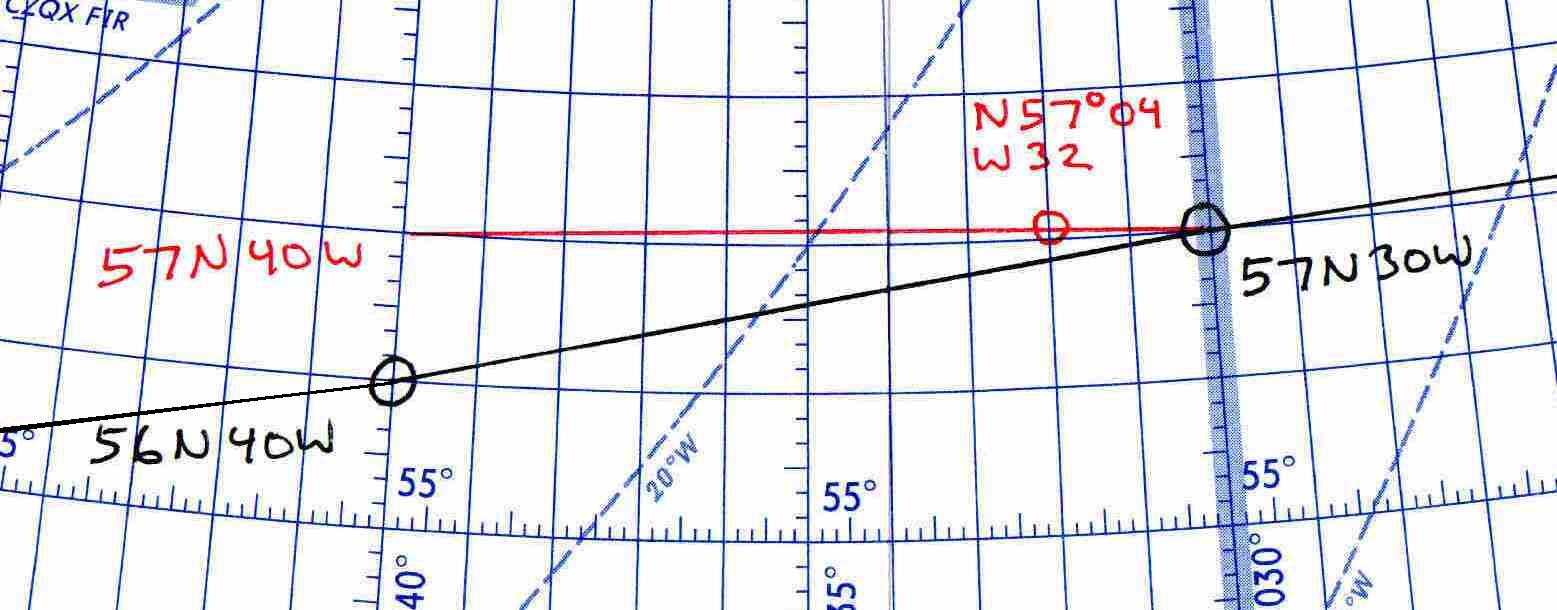
The classic one-degree error
People still make the one-degree error but we are more likely to hear about oceanic re-routes that crews missed or entered in error.
- Oceanic Reroute — Reroutes are common and except in rare combinations of aircraft/controller CPDLC capabilities, will require crews to manually enter FMS waypoints. I often read about crews that somehow mishandled the data entry. Plotting could have saved them.
- An FMS error — yes, these happen. A few years ago the FMS makers didn't all agree on what nomenclature was needed for half-degree latitude separation and the result was chaos. The pilots who plotted caught the error. Another cause, albeit rare, is a coding error that waited until the database was updated. The first airplane to fly the route when the new database went into effect was caught. I've caught two such errors, but both were over continental Europe, not oceanic.
- Other "technical" errors. Navigation databases are incredibly complicated and with the complication comes the chance for errors. See Why the Pilot is the Last Line of Defense, below.
But what if I'm doing everything perfectly?
Just because you are doing everything "by the book" doesn't mean another aircraft's errors can't impact you. How is plotting going to save you from another airplane's error? Here is a scenario for you. Let's say you filed Mach 0.80 as did the airplane in front of you, but the airplane behind you filed M0.83. Shanwick Oceanic planned on all this by placing the minimum spacing between you and the lead aircraft and allowed extra space between you and the third. Now let's say there is an unforecast increase in the tailwind and all three airplanes start to miss their next forecast ETA. (You are early.) You and the third aircraft revise your ETAs, as required, while maintaining your filed Mach Numbers. The lead aircraft, however, slows down to avoid having to revise his ETA and there is a loss of separation between you and the lead aircraft. Shanwick will be asking for all three aircraft to provide their paperwork and having shoddy paperwork may implicate the wrong crew.
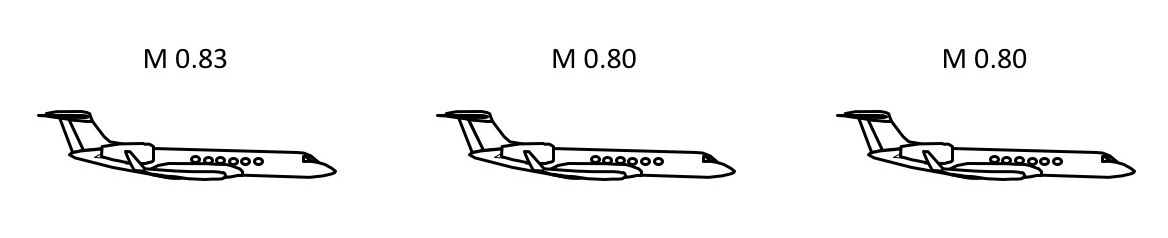
Mach Number Technique
No matter the reason, I like to think of it this way. When you are flying domestically all of your airplane's wizardry is keeping you separated from other airplanes and air traffic control's radar is backing everything up. When you are flying oceanic you don't have ATC's radar to help you out. It is up to you to back up the airplane's computers.
Even if you've flown the route a hundred times (an example of a good pilot gone bad)
You don't know every quirk of your FMS and sometimes that can bite you. For example, the Gulfstream GV FMS originally had a 100 waypoint limitation; that's a lot of waypoints. Well, no, it isn't. It is easy to have more than 100 when flying through Europe. One of our TAG Aviation pilots in 2005 was an old pro at flying from London to White Plains, over and over again. On one of his trips they departed Italy instead. He simply downloaded the flight plan and headed west. The crew didn't plot, didn't check the FMS, and ran out of waypoints at 30° West longitude. At that point, the airplane turned directly to White Plains. How do you spell Gross Navigational Error? The North Atlantic powers that be referred the case to the FAA who referred the case to our standards group. The pilots in question did not fare well. Plotting would have saved them.
3
When should you plot?
I think the practical answer to the "when do I have to plot?" question is whenever you don't have a backup to the space-based and inertial-based navigation. There used to be an actual answer in writing:
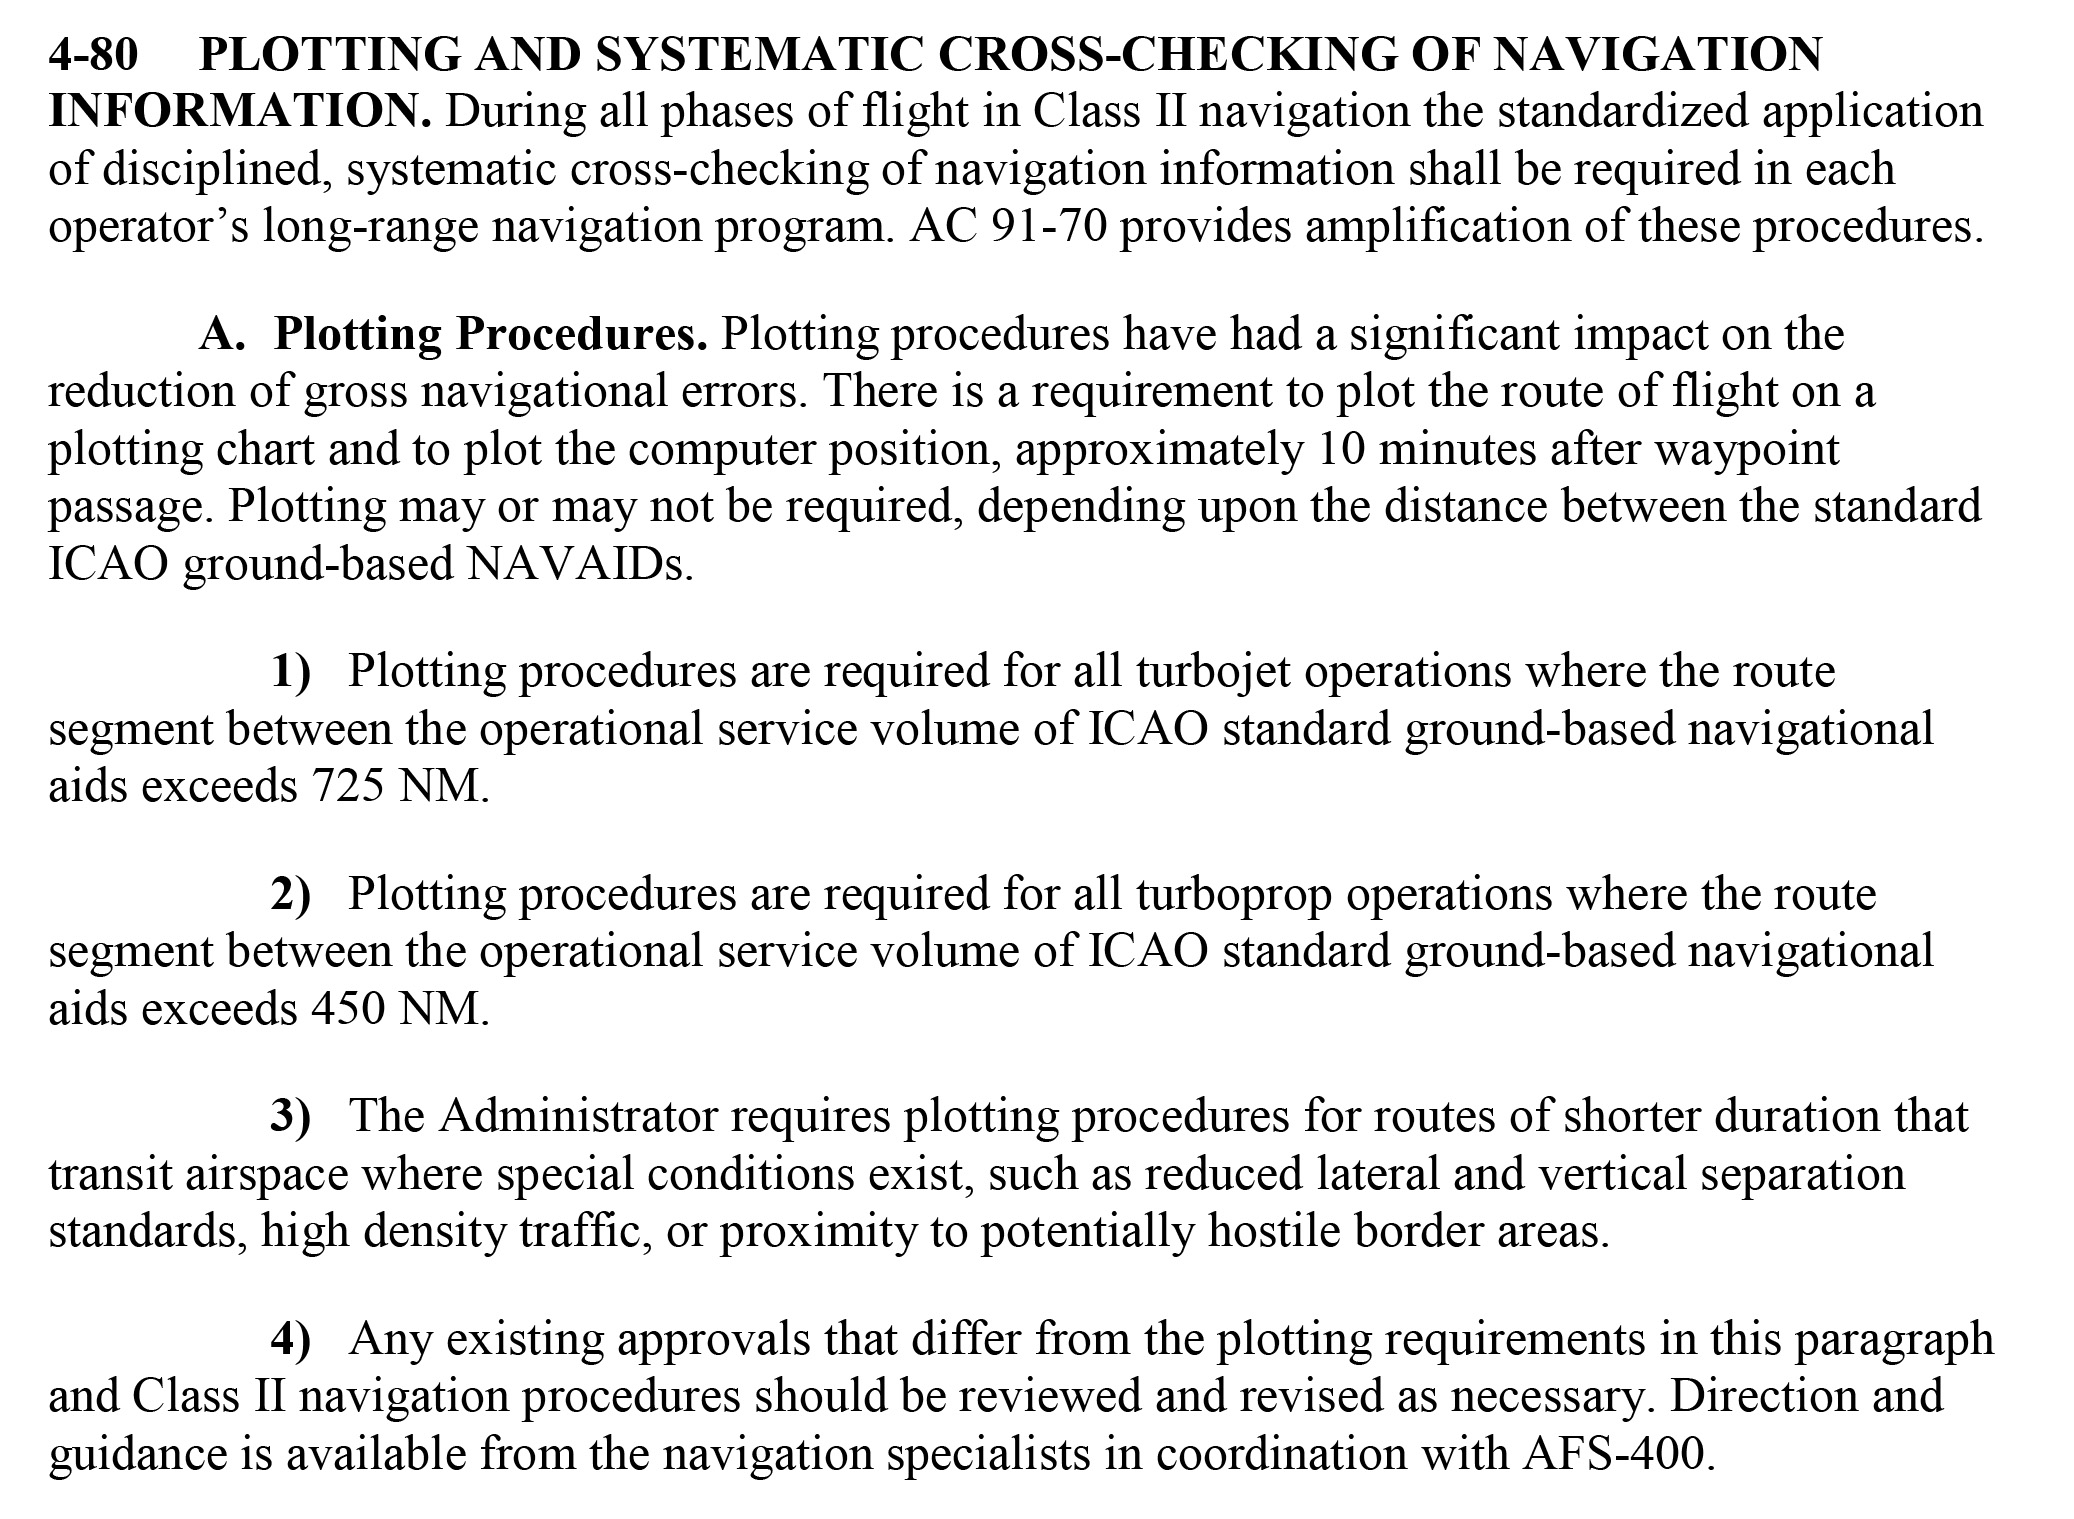
- Plotting Procedures. Plotting procedures have had a significant impact on the reduction of gross navigational errors. There is a requirement to plot the route of flight on a plotting chart and to plot the computer position, approximately 10 minutes after waypoint passage. Plotting may or may not be required, depending upon the distance between the standard ICAO ground-based NAVAIDs.
- Plotting procedures are required for all turbojet operations where the route segment between the operational service volume of ICAO standard ground-based navigational aids exceeds 725 NM.
- Plotting procedures are required for all turboprop operations where the route segment between the operational service volume of ICAO standard ground-based navigational aids exceeds 450 NM.
- The Administrator requires plotting procedures for routes of shorter duration that transit airspace where special conditions exist, such as reduced lateral and vertical separation standards, high density traffic, or proximity to potentially hostile border areas.
- Any existing approvals that differ from the plotting requirements in this paragraph and Class II navigation procedures should be reviewed and revised as necessary. Direction and guidance is available from the navigation specialists in coordination with AFS-400.
Source: FAA Order 8900.1 OUTDATED VERSION Volume 4, Chapter 1, Paragraph 4-80.A
What is the service volume of a navigation aid?
Standard High Altitude Service Volumes
(AIM, Figure 1-1-1.)
You could have a navaid tuned and identified far outside its service volume, which means it doesn't count when making the plot / don't plot decision. Typical service volumes from Aeronautical Information Manual, ¶1-1-8:
- Standard High Altitude Service Volume between 18,000 and 45,000 ft: 130 nm
- Standard Low Altitude Service Volume between 1,000 and 18,000 ft: 40 nm
- Standard Terminal Service Volume between 1,000 and 12,000 ft: 25 nm
- NDB HH Service Volume: 75 nm
- NDB MH Service Volume: 25 nm
So the service volume of a qualified navaid answer isn't binding anymore, but it gives you an idea where you really should be plotting. (I like my earlier answer better.)
What about fixed airways?
I often hear from crews that want reassurance that there is no need to plot the routes between California and Hawaii because they are fixed and appear on their charts. They are wrong.
The Hawaii "Romeo" Routes
They are much more than 725 nm outside the service volume of the nearest navigation aid, they have to (and should) plot.
4
Why the pilot is the last line of defense
The following is extracted verbatim from Andreas Horn's exceptional pilot vlog Engineering Pilot.
In the early days of aviation, pilots used landmarks and light beacons to navigate. They were later replaced by radio beacons, such as NDB or VOR. The pilot or navigator would look up a beacon’s parameters on a map and then tune the specific frequency on the receiving equipment. He would then listen for the identification (a Morse code) and subsequently use the readout to determine the aircraft position. This paradigm imposed a heavy mental workload on the flight crew, but the “navigation data” (i.e. the maps) were quite primitive.
Today, the opposite is true: The creation of “navigation data” has become a complex undertaking and at the same time, the mental workload for the flight crew to find the way from Paris to Moscow is quite low, as pilots can simply enter the destination using a dedicated interface. There is just one problem: What if the waypoint in the aircraft database would be in a different location than the same waypoint on the map? This would obviously be a recipe for trouble and therefore it is vital that the integrity of our navigation data is ensured. But let us look in a step-by-step manner at how the aeronautical data is promulgated:
Traditionally, aeronautical data is distributed via a system of common effective dates, known as “Aeronautical Information Regulation And Control” (AIRAC). ICAO document 10066 specifies an aeronautical data catalogue, in order to facilitate the creation and distribution of digital data sets by the AIS of each member state. This also serves as an effort, to enable the transition from “paper AIP” as a reference to digital sources including meta data.
Source: Horn
Data promulgation flow from state to aircraft, Horn, figure 3.
In a simplified way, the flow can be described as in Figure 3 above. The states publish official data in their AIP. It is then “translated” into a code which is "machine readable", in this case: ARINC424. Then it is up the equipment manufacturer to format the data so that it can be stored on a particular memory of a product. Starting with the creation of "raw data" there are many steps involved and also multiple entities. So there are several occasions for the data to be corrupted.
Source: Horn
Andreas provides an example of critical data in an RNP approach which encodes several segments into values which are added up to produce a "Cyclic Redundancy Check (CRC)" value. The discussion is a bit technical and I encourage you to read his article in full if you are so inclined.
The CRC process was proposed in the 1960’s and has been adopted in many communication applications since. It is quite simple to implement in hardware, as it relies on polynomial division and modulo 2 arithmetic. The idea is brilliant: At the transmitter side, the data is divided by a so-called “generator polynomial”, which creates a remainder. (There are many rules as to how to choose the generator polynomial, but that would be beyond the scope of this article…). The CRC remainder is then “added” as a bit-sequence to the data. On the receiver side, the data string together with the CRC remainder are now divided by the same generator polynomial. This division will have no remainder, if all worked correctly. The reason for this is, that we are using binary division and modulo 2 arithmetic. Should there be a new remainder, the data would have been corrupted. A single changed bit will therefore be immediately detected.
There are significant drawbacks of CRC though, and it is being replaced more and more by Reed-Solomon codes and hash functions. The two major problems are that it does NOT protect against intentionally introduced errors and it’s capability to be used for error correction is quite limited. The former being increasingly relevant as aircraft data management is getting in the focus of cyber-security.
No matter what computer and algorithm we use, they all have one thing in common: The old programmer mantra: “GIGO” Garbage in – garbage out. So even the most sophisticated hash function will not prevent errors that are made right at the start of the process, during the data definition phase.
Therefore it is absolutely vital for every pilot to have a healthy level of skepticism towards the “green line” on the navigation display. A good practice can be to compare “desired tracks” and distances and to speak up and take action if something does not look right.
Source: Horn
References
(Source material)
*Advisory Circular 91-70A, Oceanic and International Operations, 8/12/10, U.S. Department of Transportation
* This version of AC 91-70 has been superseded but it retained because it contains older guidance that helps place current guidance into perspective.
Advisory Circular 91-70B, Oceanic and International Operations, 10/4/16, U.S. Department of Transportation
Aeronautical Information Manual
FAA Orders 8400 and 8900
Horn, Andreas, "Getting to the right place," 9 October 2019, Engineering Pilot.
ICAO Annex 4 - Aeronautical Charts, International Standards and Recommended Practices, Annex 4 to the Convention on International Civil Aviation, July 2009