There are other methods that make all of this very easy, but you should know how to plot the old fashioned way.
— James Albright

Updated:
2021-10-03
Why? Because (a) the FAA will expect you to demonstrate if you are applying for the necessary LOA, and (b) it will help you understand what your automatic methods are doing and to detect any errors from those systems.
1 — A plotting chart should include . . .
2 — How is a common plotting chart laid out?
7 — Start / mid / end point differences
8 — How to determine a magnetic course
9 — How to determine the position of a VOR radial/DME
In other articles, we'll cover:
How to Plot, Paperless Methods

1
A plotting chart should include . . .
Your chart should include, at a minimum:
- The route of your filed flight plan or currently effective route clearance.
- Clearly depicted waypoints using standardized symbology.
- Graphic depictions of all ETPs.
- Alternate airports.
- Proximity of other adjacent tracks.
Note: For certificated operators, if OpSpec/MSpec A061 has been issued authorizing use of an Electronic Flight Bag (EFB) and the principal inspector (PI) has authorized “interactive plotting for oceanic and remote continental navigation,” the EFB application may be used in place of a paper plotting/orientation chart. The current edition of AC 120-76, Guidelines for the Certification, Airworthiness, and Operational Approval of Electronic Flight Bags, provides guidance for operators to develop associated EFB procedures. For part 91 operators, an EFB may be used, provided the criteria and considerations of the current edition of AC 91-78, Use of Class 1 or Class 2 Electronic Flight Bag (EFB), are observed.
Source: AC 91-70B, ¶6.3.1.11.2
2
How is a common plotting chart laid out?
Apart from saying the chart should be north up, must be based on WGS-84 and mean sea level, the chart printers are pretty much given discretion on how to print their plotting charts.
Plotting chart layout
- 2.1.7 Recommendation.— The charts should be True North orientated.
- 2.15.1 True North and magnetic variation shall be indicated. The order of resolution of magnetic variation shall be that as specified for a particular chart.
- 2.15.2 Recommendation.— When magnetic variation is shown on a chart, the values shown should be those for the year nearest to the date of publication that is divisible by 5, i.e. 1980, 1985, etc.
- 2.18.1.1 World Geodetic System — 1984 (WGS-84) shall be used as the horizontal (geodetic) reference system. Published aeronautical geographical coordinates (indicating latitude and longitude) shall be expressed in terms of the WGS-84 geodetic reference datum.
- 2.18.2.1 Mean sea level (MSL) datum, which gives the relationship of gravity-related height (elevation) to a surface known as the geoid, shall be used as the vertical reference system.
Source: ICAO Annex 4
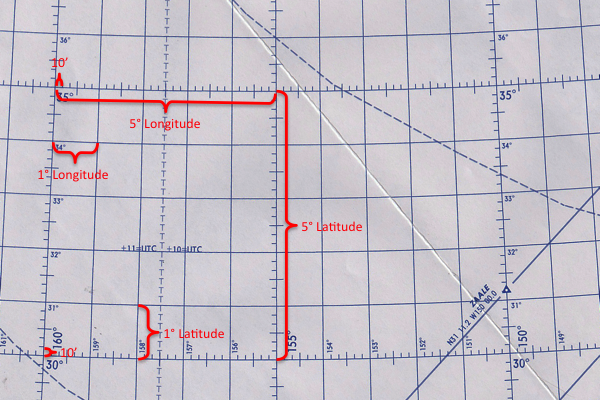
There are some basic guidelines you should know for the chart you are using:
- The horizontal lines are "parallels of latitude," usually a line for every degree with a major line every five degrees.
- The vertical lines are "meridians of longitude," with a line for every degree with a major line every five degrees.
- Longitude and latitude are subdivided into 60 parts known as minutes and labeled with a single quote mark (').
- Minutes are further subdivided into 60 parts known as seconds and labeled with double quote marks (").
- Bedford (KBED) airport, for example is at 42°28'11.8" N, 71°17'20.4" W; which is pronounced "forty-two degrees, twenty-eight minutes, eleven point eight seconds north, seventy-one degrees, seventeen minutes, twenty point four seconds west.
More about this: Coordinates.
3
How to plot a position
There are many techniques on how to do this correctly, here is mine:
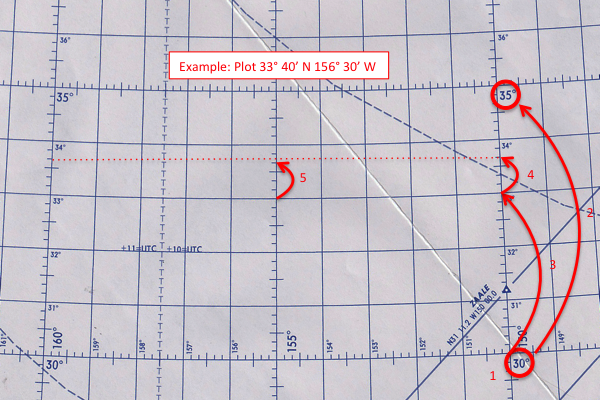
Position plotting example
- Ensure you are in the correct quadrant: In the north the latitudes increase as you go up, in the south they increase as you go down. In the west the longitudes go up as you head west, in the east the go up as you head further east. Locate the nearest five degree line in the general area of your point, in the example 30° N.
- Locate the five degree line just above your latitude, in our example 35° N.
- If your chart has one degree markings locate the nearest degree below your point, otherwise count the degree lines. In our example 33° N.
- Count the tick marks between degree lines on the chart you are using. In our example there are six so we conclude each tick mark represents 10 minutes of latitude. Counting up four tick marks we identify 30°40' N latitude.
- Notice that a line connecting 33°40' N 150° W and 33°40' N 160° W does not cross 33°40' N 155° W, it runs high. That's because the chart is a Lambert Conformal Projection which bends toward the poles. To get a more accurate position, we need to find the 33°40' point on the scale closest to our position.
Position plotting example
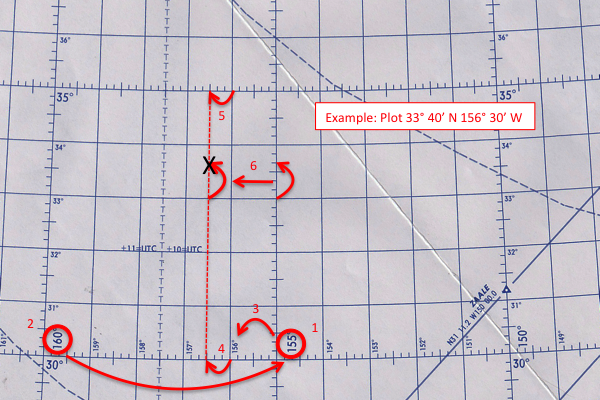
- When dealing with longitude, we look for the nearest five degree line under our desired position, in our example 155° W.
- Then we look for the nearest five degree line greater than our desired position, in our example 160° W.
- We can now locate the nearest degree under our position, in our example 156° W.
- Counting the tick marks, we see there are six so 30' of longitude will be three greater.
- Unlike latitude, lines of longitude appear parallel between lines of latitude, so we can draw a line at 156°30' W between tick marks and it will remain accurate.
- We then transpose our mark identifying 33°40' N to this line of longitude and viola, we have our position.
4
How to plot a true course
For a tutorial on headings, courses, variation, and the like, see: Direction.
Understanding true versus magnetic heading
Part of the plotting process is to check the courses in your FMS (which are almost always in Magnetic) against those on your charts (which are in True). To convert from True to Magnetic you need Variation.
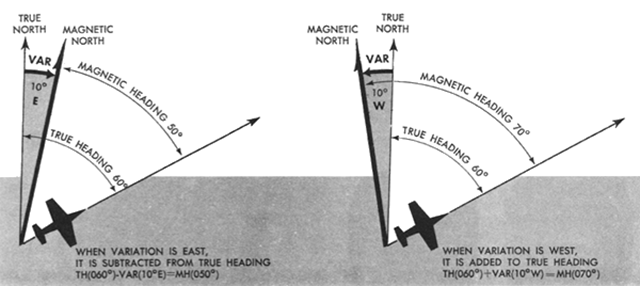
Variation, (AFM 51-37, page 1-13)
The magnetic compass points to magnetic north. The angular difference between true and magnetic north is known as variation and it changes for different locations on the earth. Variation must be considered when converting true course, true headings, or true winds to magnetic direction.
Source: AFM 51-37, page 1-12.
If you need to convert, the formula is:
True + Variation = Magnetic
Where West Variation is positive and East Variation is negative
If, for example, you measure a True course of 090 on the chart and the nearest line of Variation is 10° East, the Magnetic course will be 090 - 10 = 080° (Because you subtract East Variation.)
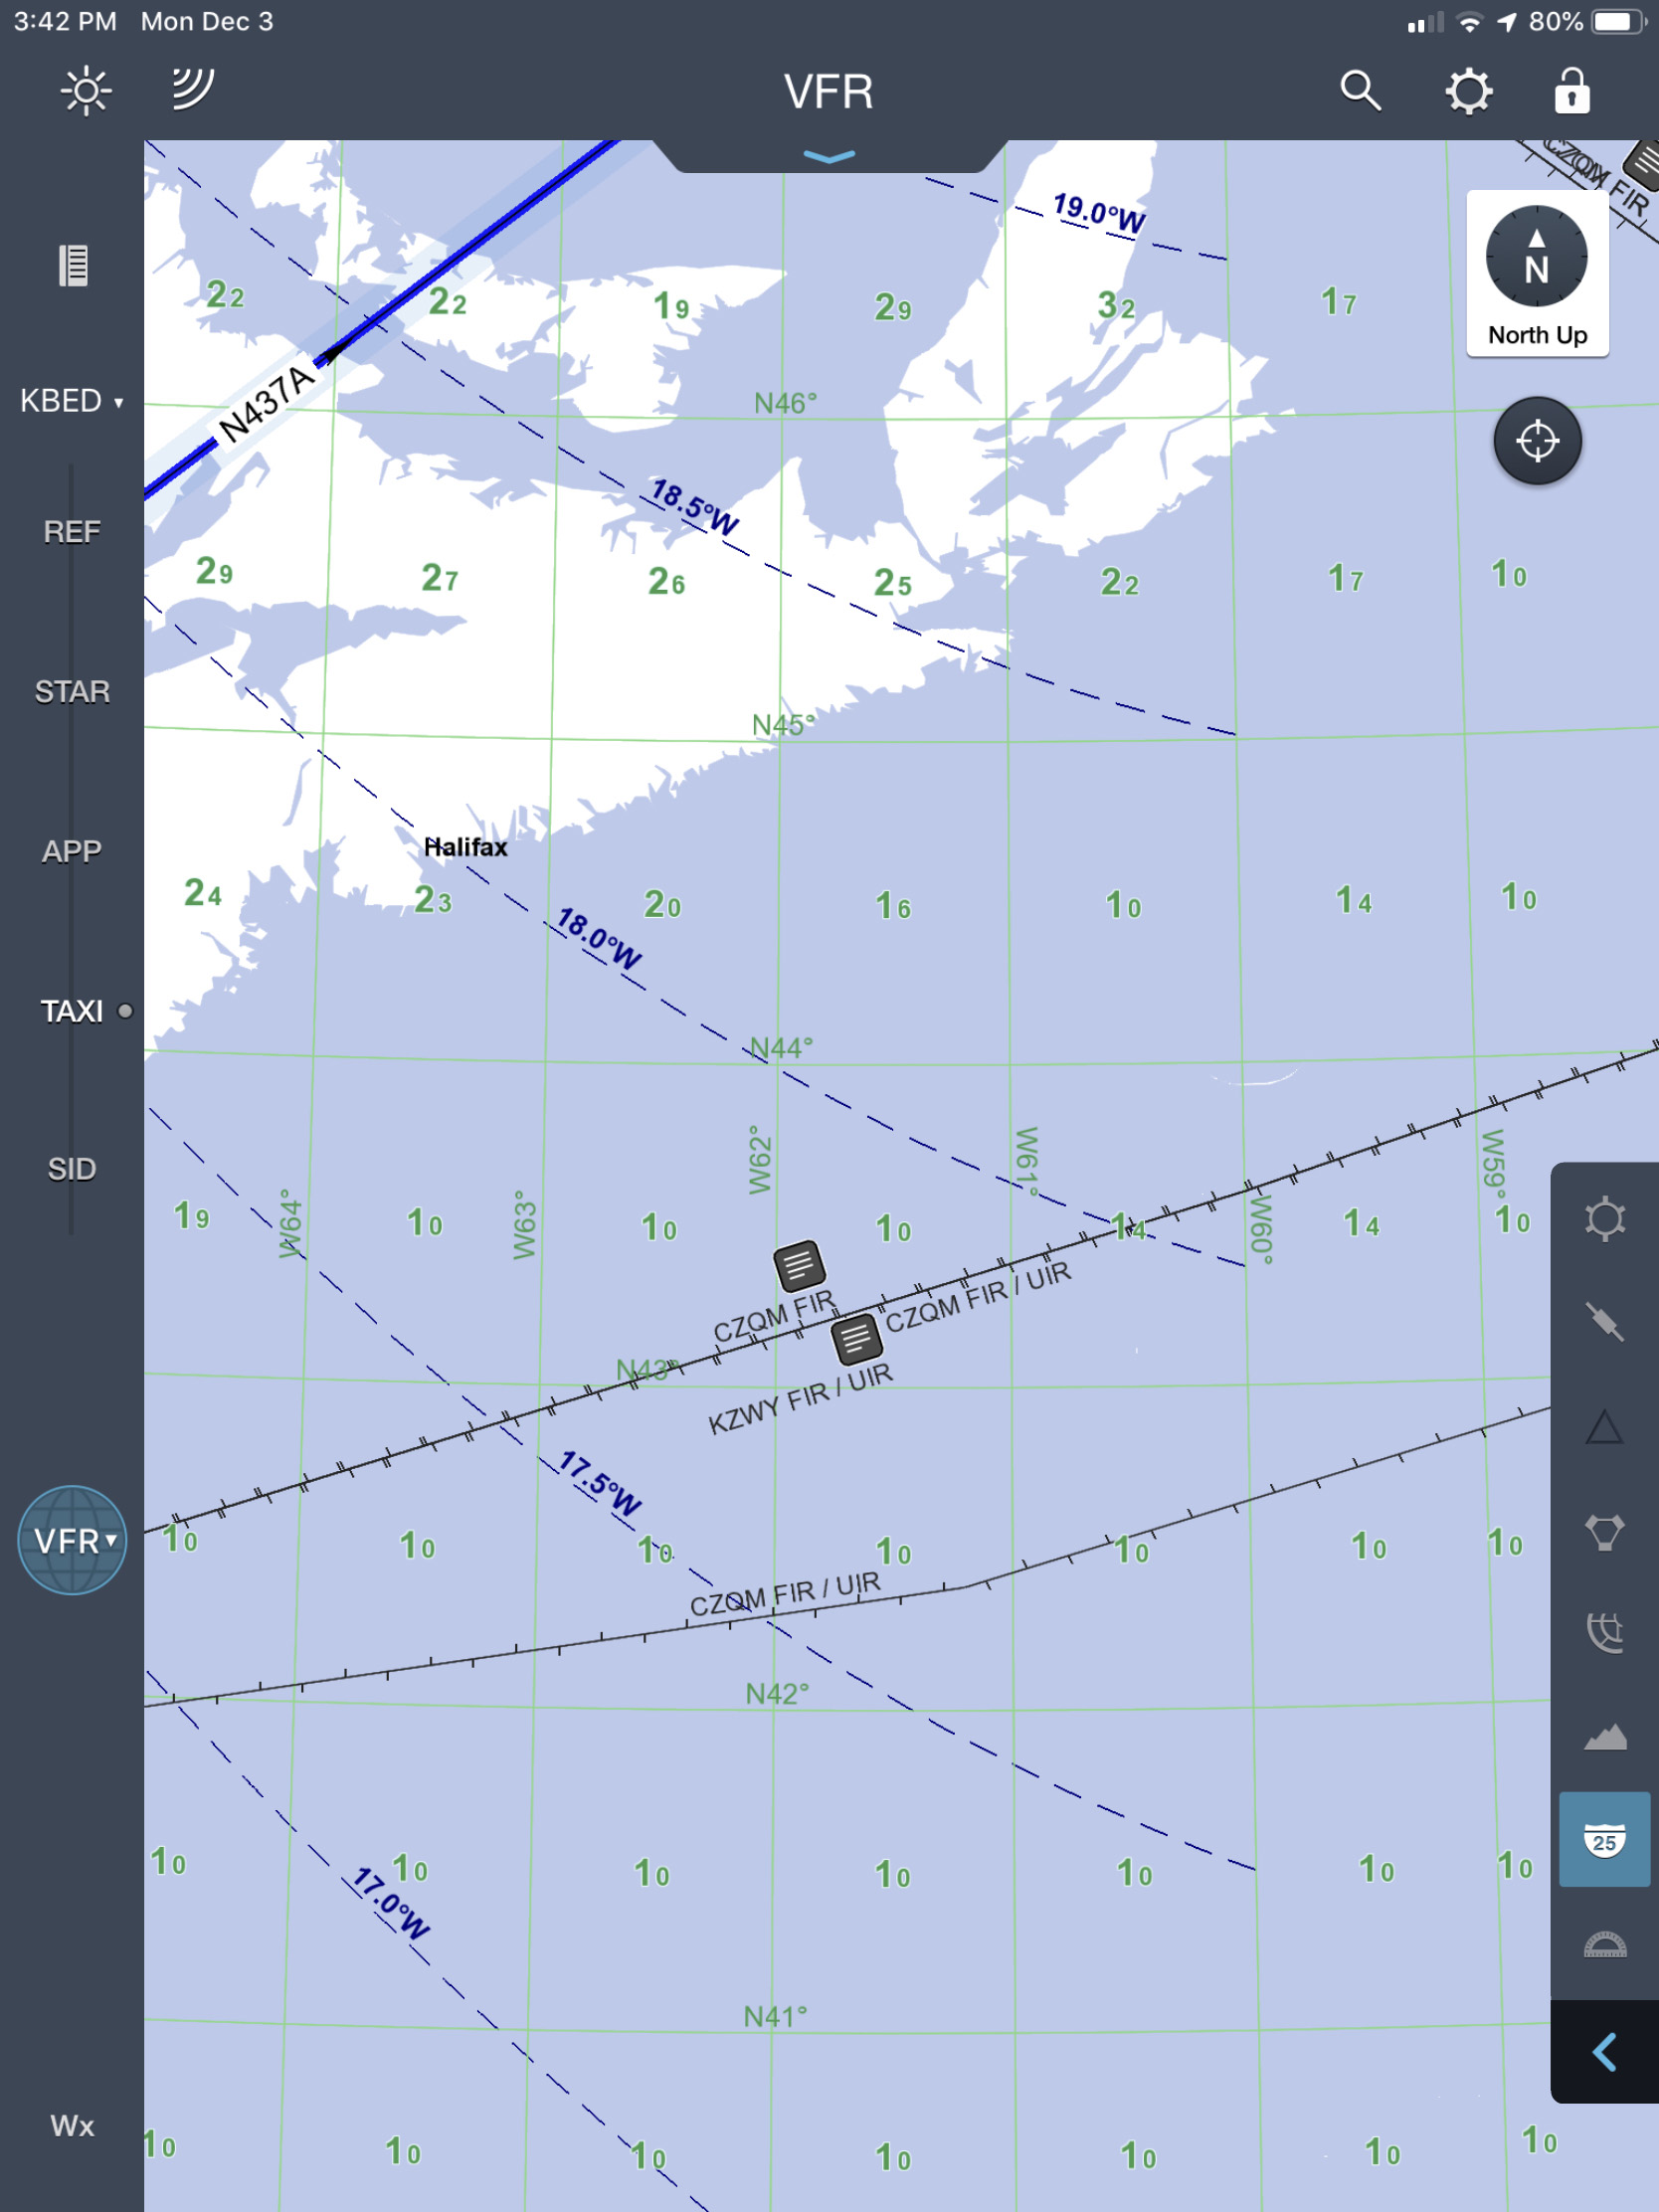
Finding variation in JeppFD
If you don't have a paper chart, you may not find variation on the electronic chart. In JeppFD, for example, you need to select "VFR" from the chart type (left side of the accompanying photo), select the "Interstate 25" sign (right side of the accompanying photo), and zoom down to a fairly small scale. This works just about everywhere in the world except the North Atlantic, where variation magically disappears. For those of you without JeppFD and even for JeppFD users over the North Atlantic, your FMS should display variation for each waypoint.
5
Measuring course
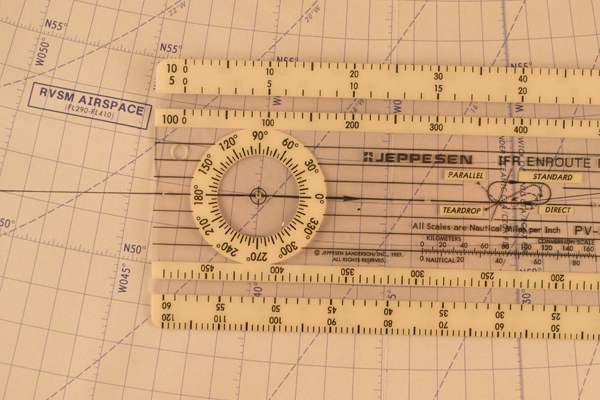
Jeppesen Plotter
A plotter is nothing more than a circular instrument designed to give angular differences between lines. A navigation plotter, such as the Jeppesen model shown, will typically have a hole in the center of a compass rose. To use:
- Decide if you want the start, mid, or ending course. Most pilots will need the start course. For more about this, see: Start / Min / End Point Differences.
- Place the hole in the center of the compass rose over a line of longitude near the desired point, in our example we've used 40°W which is also the longitude of our start point.
- Align the line along the 0° mark to your desired course. You may find it helpful to insert your pencil or pen point in the hole while rotating the plotter to line up with your course.
- Read the true course along the line of selected longitude, 085° in our example.
Note: You will have two choices aligned with the line of longitude, 085° and 275° in our example. In most cases it will be the number on top, but when dealing with courses near vertical it can be confusing. Always remember to give your answer a common sense check. In our example, we are headed to Europe and the answer should be generally easterly.
6
Measuring distance
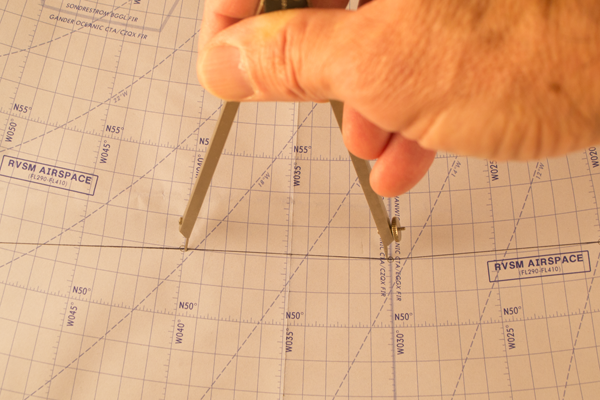
Dividers, step 1
- One of the disadvantages of the Lambert Conformal chart is the lack of a constant scale. If the two points between which the distance is to be measured are approximately in a north-south direction and the total distance between them can be spanned, the distance can be measure on the latitude scale opposite the midpoint. However, the total distance between any two points that do not lie approximately north or south of each other should be be spanned unless the distance is short. All distances should be measured as near the mid latitude as possible.
- In the measurement of long distances, select a mid latitude lying approximately half-way between the latitudes of the two points. By using dividers set to a convenient, reasonably short distance, such as 60 nautical miles picked off at the mid latitude scale, you may determine an approximate distance by marking off units along the line to be measures as shown [in the figure].
- The scale at mid latitude is accurate enough if the course line does not cover more than 5 degrees of latitude (somewhat less at high latitudes). If the course line exceeds this amount or if it is crosses the equator, divide it into two or more legs and measure the length of each leg with the scale of its own mid latitude
Source: AFM 51-40, Page 5-8.
If you have a set of dividers and a flat surface you aren't afraid to scratch, find the distance between waypoints is quite easy. First, place the points of the dividers on the start and end waypoints.
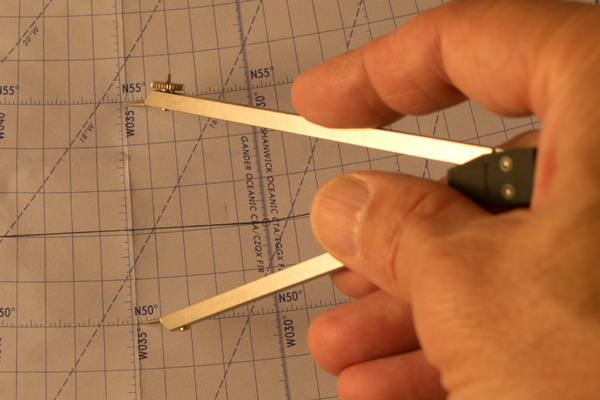
Dividers, step 2
Next, find a line of longitude near the course line. It is important to use a line of longitude about the same latitude as the course, since these will change over great distances. Each degree of latitude equals 60 nautical miles.
Post It Measuring Tool
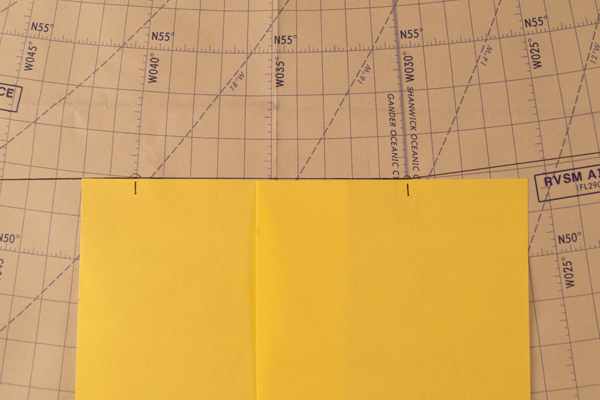
If you don't have a set of dividers — do you really want to have such a sharp instrument in the cockpit? — you can construct your own with a PostIt note or other straight-edged paper. You will be accurate within a nautical mile if you do it this way:
- Place the straight-edged paper along side the course. In our example, the PostIt note isn't long enough so we've used two, overlapping, notes.
- Place a tick mark at the starting and ending waypoints.
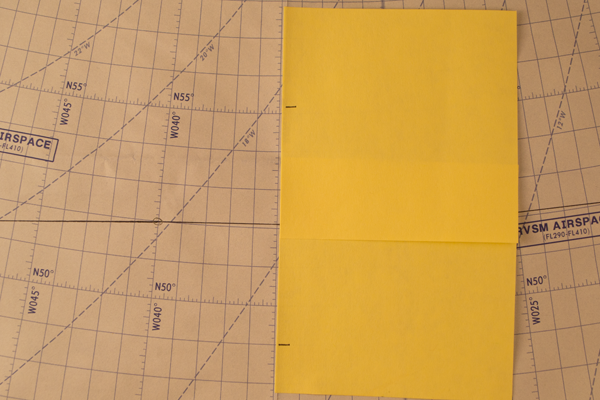
Post It Measuring Tool
- Move the straight-edged paper to the nearest line of longitude at about the same latitude. Place one tick mark over a convenient line of latitude, 49°N in our example.
- Read the distance from the ending tick mark, using 60 nautical miles per degree. In our example the distance covers at least 6° of latitude, which comes to 360 nautical miles. The mark goes further by a tenth of a degree, meaning another 10 nautical miles. We conclude the distance between waypoints is therefore 370 nautical miles.
Note: You can also determine the distance using a set of "10 Degree Tables," where we would see the exact distance is actually 369 nautical miles. (Our PostIt note was off by 1 nautical mile, or had an error rate of 0.27 percent, not bad.
More about this: 10 Degree Tables.
7
Start / mid / end point differences
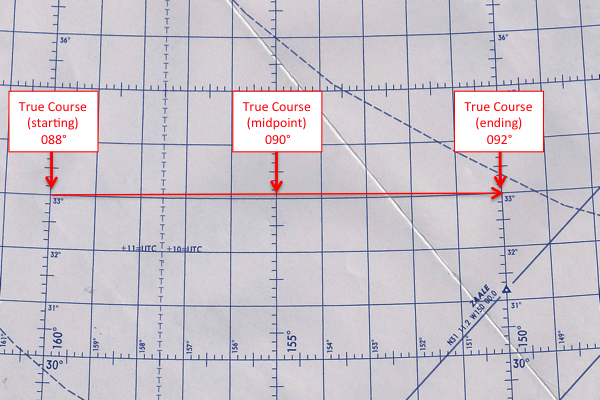
Starting vs Mid vs Ending Points
Your plotting chart is based on a Lambert Conformal projection, the lines of longitude converge near the poles. Except for the equator, the lines of latitude are not straight, they curve toward the equator. The measurement of your true course depends on where you place the center of your plotter and it does make a difference. In the figure shown, flying from 33°N 160°W to 33°N 150°W should, intuitively, require a 090° true course. The actual course, however, depends on what you want: the starting, mid, or ending course.
Most flight planning services offer either the starting or midpoint courses. Some pilots want to know what their initial course will be, others want the average course on the entire leg. It is a matter of personal preference.
I prefer using the starting course, since that is what the FMS will be showing prior to crossing the waypoint. (Following waypoint passage the course will update to reflect the "current" great circle route to the next waypoint. This course will constantly update as you progress, only reaching the midpoint course when you are actually at the midpoint.)
More about this: Navigation: Initial vs. Midpoint Course.
8
How to determine a magnetic course
True Course plus Variation equals Magnetic Course . . .
Variation Example
To determine the magnetic course, you will need to add or subtract the variation:
- Look for the nearest lines of magnetic variation on the chart before and after the midpoint and interpolate if necessary.
- If the variation is West, add this value to the true course to determine magnetic course. If the variation is East, subtract this value from the true course to determine magnetic course:
TC + West Variation = MC
TC - East Variation = MC
In our example, it appears our midpoint is very close to the "16°W" line of variation and no interpolation is necessary. Based on this we add 16 to our 270 true course and verify that our FMS and flight plan show a 286° magnetic course plus or minus a few degrees.
For a tutorial on magnetic variation, see: Direction.
Note: It is not uncommon to find differences of 2 or 3 degrees in the magnetic course determined from a plotting chart and that reported in a computer flight plan. The magnetic variation changes over the years and your chart may be dated or hasn't been updated with the correct variation.
9
How to determine the position of a VOR radial/DME
There are many ways to turn a VOR radial/DME into a latitude and longitude, the best of these may very well be inside your FMS. If you need to do this on a plotting chart, this method works well:
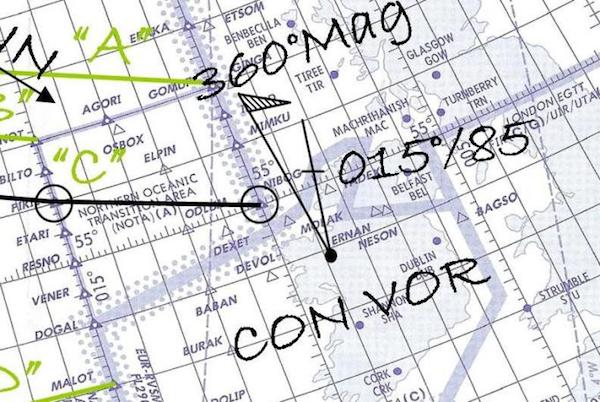
VOR/DME Plotting
- Place the plotter hole over the VOR in question and your pencil point in the hole to hold the plotter centered over the VOR. (CON in our example.)
- Find the nearest line of variation. (6° West in our example.)
- Rotate the edge of the plotter to 360* in the northern hemisphere, 180* in the southern hemisphere, and then rotate toward the magnetic pole by the amount of the variation. (Rotate 6* to the west, in our example.)
- Move your pencil from the center hole to the straight line of the plotter that describes the line to the magnetic pole, move the plotter so the straight edge connects that point to the VOR. Draw a line with a flag on it from the VOR in the direction of the pole. Label this line "360° Mag" if you like. (In our example the flag points slightly left.
- Now return the plotter center hole to the VOR and rotate it in relation to your 360° Mag line by the number of degrees in the VOR radial. Draw a line as you did earlier by placing a tick mark, moving the plotter, and drawing the line. (In our example the line is 15° clockwise from the Magnetic north line.)
- Determine the distance using the Distance Measuring techniques shown above. Place a tick mark on the VOR line. (015°/85 DME in our example.)
- The latitude and longitude can be read directly from the chart using the Plot a Position techniques shown above. (55°15'N 8°25'W in our example.)
If you are doing this to check the accuracy of your FMS, you might have easier tools at your disposal. More about this: Navigation Accuracy Check.
References
(Source material)
14 CFR 1, Title 14: Aeronautics and Space, Definitions and Abbreviations, Federal Aviation Administration, Department of Transportation
14 CFR 91, Title 14: Aeronautics and Space, General Operating and Flight Rules, Federal Aviation Administration, Department of Transportation
14 CFR 121, Title 14: Aeronautics and Space, Operating Requirements: Domestic, Flag, and Supplemental Operations, Federal Aviation Administration, Department of Transportation
14 CFR 125, Title 14: Aeronautics and Space, Certification and Operations: Airplanes Having a Seating Capacity of 20 or More Passengers or a Maximum Payload Capacity of 6,000 Pounds or More; and Rules Governing Persons on Board Such Aircraft, Federal Aviation Administration, Department of Transportation
14 CFR 135, Title 14: Aeronautics and Space, Operating Requirements: Commuter and On Demand Operations and Rules Governing Persons on Board Such Aircraft, Federal Aviation Administration, Department of Transportation
47 CFR 22, Tile 47: Telecommunication, Federal Communications Commission
A Report from the Portable Electronic Devices (PED) Aviation Rule Making Committee (ARC) to the Federal Aviation Administration (FAA), September 30, 2013
Advisory Circular 91.21-1D, Use of Portable Electronic Devices Aboard Aircraft, 10/27/17, Department of Transportation
*Advisory Circular 91-70A, Oceanic and International Operations, 8/12/10, U.S. Department of Transportation
* This version of AC 91-70 has been superseded but it retained because it contains older guidance that helps place current guidance into perspective.
Advisory Circular 91-70B, Oceanic and International Operations, 10/4/16, U.S. Department of Transportation
Advisory Circular 120-76D, Authorization for use of Electronic Flight Bags, 10/27/17, Department of Transportation
Aeronautical Information Manual
Air Force Manual (AFM) 51-40, Air Navigation, Flying Training, 1 July 1973
Horn, Andreas, "Getting to the right place," 9 October 2019, Engineering Pilot.
FAA Orders 8400 and 8900
ICAO Annex 4 - Aeronautical Charts, International Standards and Recommended Practices, Annex 4 to the Convention on International Civil Aviation, July 2009
Information for Operators (InFO) 13010, Expanding Use of Passenger Portable Electronic Devices (PED), 10/31/13, U.S. Department of Transportation
Information for Operators (InFO) Supplement 13010, FAA Aid to Operators for the Expanded Use of Passenger PEDs, June 9, 2014, Department of Transportation